Project
PointPROP
DL-based surrogate model for point cloud occulusion testing
PointPROP
GitHub Link
2025 Fall, 6.7960, MIT
Instructor: Sara Beery, Kaiming He, Omar Khattab
Collaborator: Eric Kyle Cheung
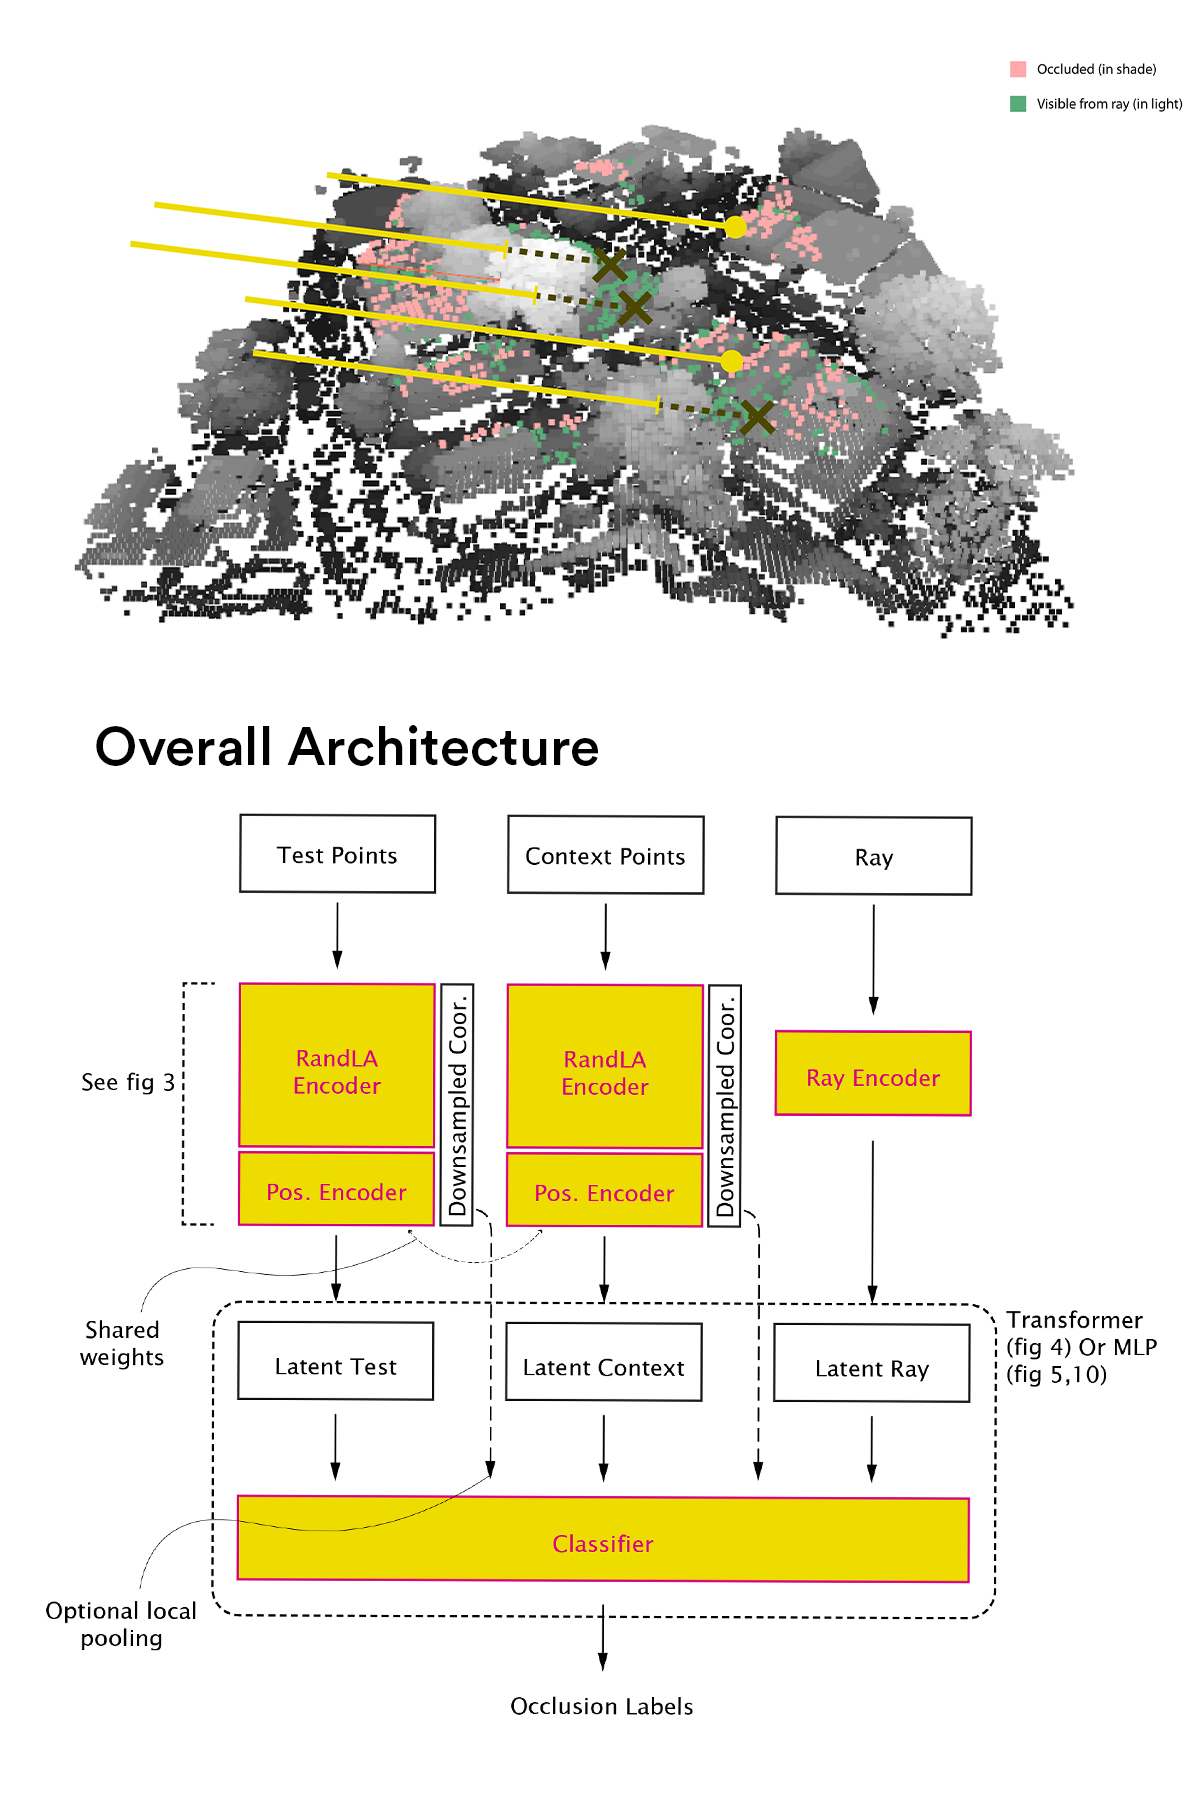
- a context point cloud pts_context ∈ ℝN×3,
- a set of test points pts_test ∈ ℝM×3, and
- a solar ray direction ray ∈ ℝ3,
f(pts_context, pts_test, ray) ∈ {0,1}M
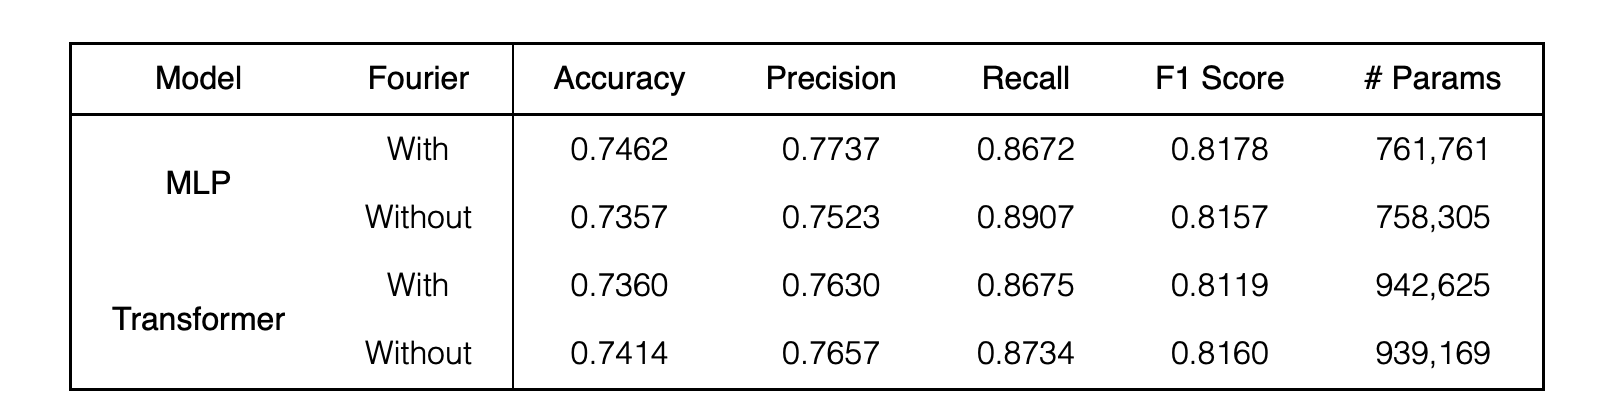
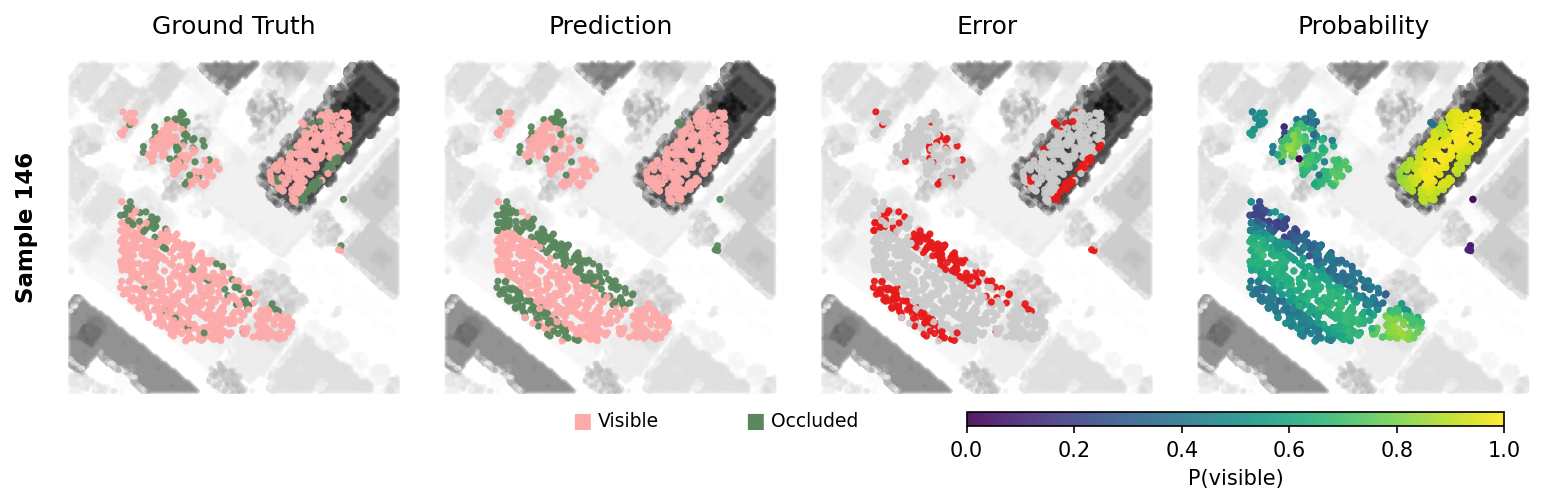
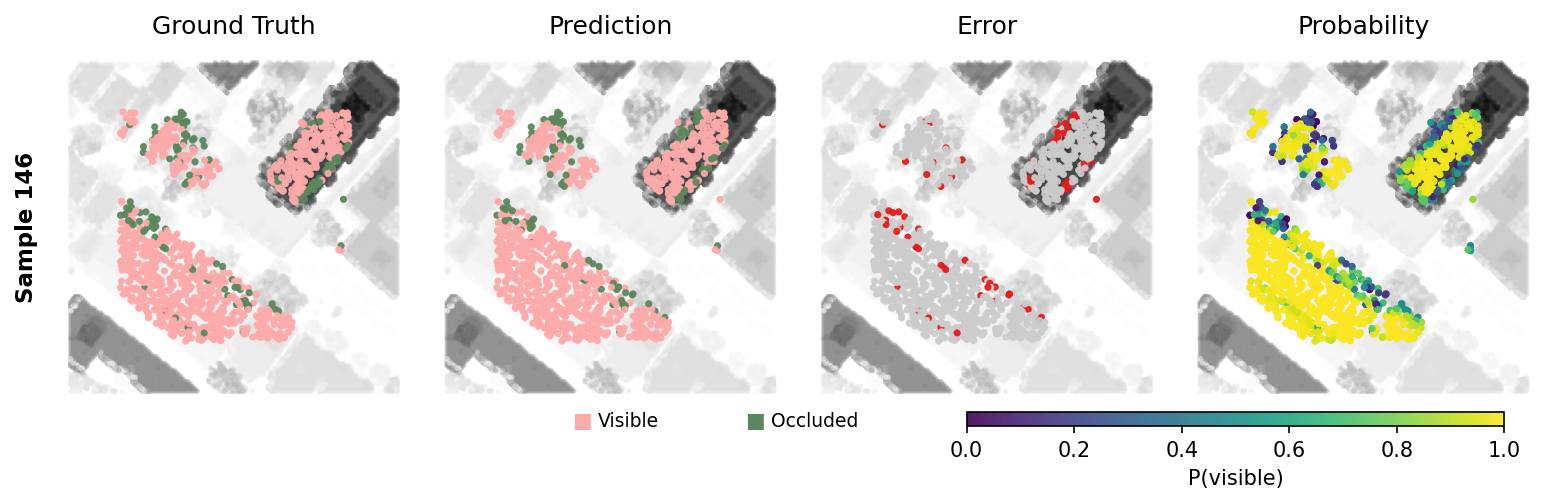
Step 1 - Baseline Comparison (Transformer vs. MLP, ± Fourier Features) We compare transformer-based and MLP-based architectures, each with and without Fourier positional embeddings, to evaluate their inductive biases for occlusion prediction. Fourier features improve convergence and slightly lower training loss, but introduce higher validation variance. Overall, all four models achieve nearly identical test performance, indicating that architectural choice and positional encoding have limited impact on final classification trade-offs. The MLP with Fourier features achieves the lowest loss and most stable convergence, while qualitative results show that models capture global occlusion patterns well but struggle with finer geometric details.
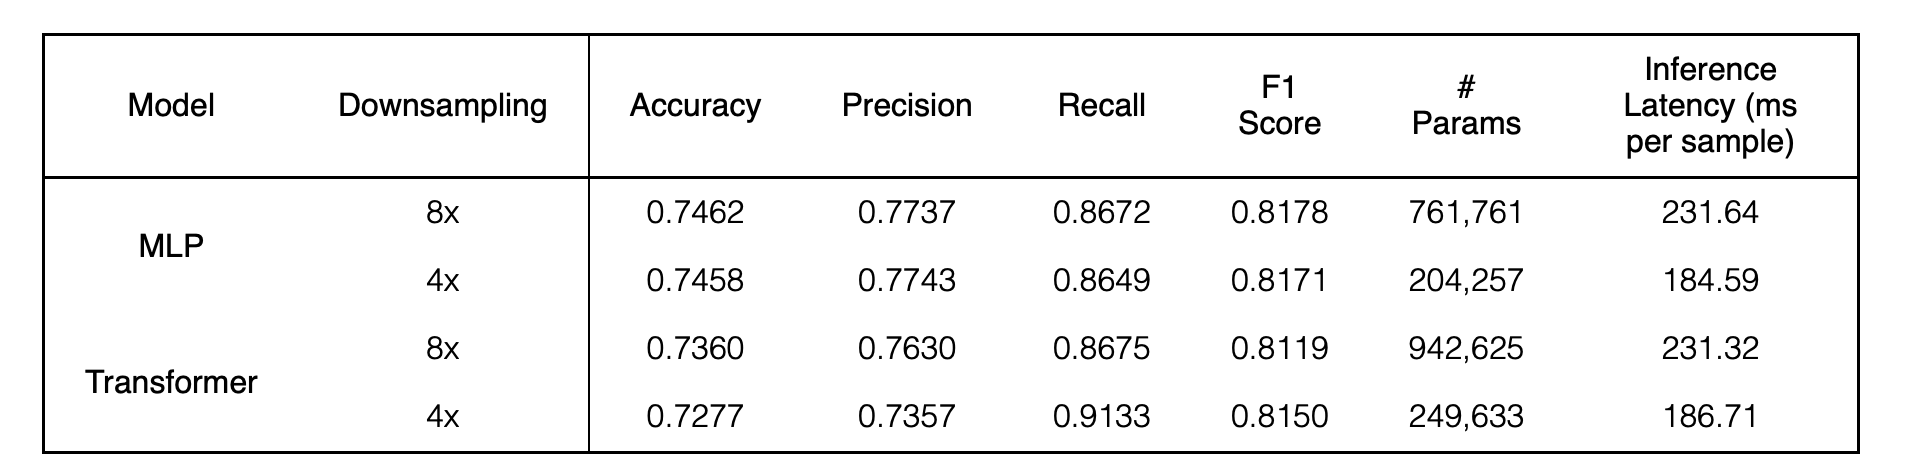
Step 2 - Capacity and Resolution Analysis We investigate whether model performance is limited by aggressive point cloud downsampling rather than architectural choice. By comparing 8× and 4× downsampling in the encode, we test the impact of spatial resolution and model capacity. Results show that reducing downsampling (4×) improves stability for the MLP without sacrificing accuracy, while the transformer becomes more prone to overfitting when given denser inputs. Importantly, lowering feature dimensions does not harm performance but significantly reduces parameter count and inference time. Overall, a shallower 4× downsampling MLP offers the best trade-off between accuracy, stability, and efficiency, suggesting that resolution is the primary bottleneck.
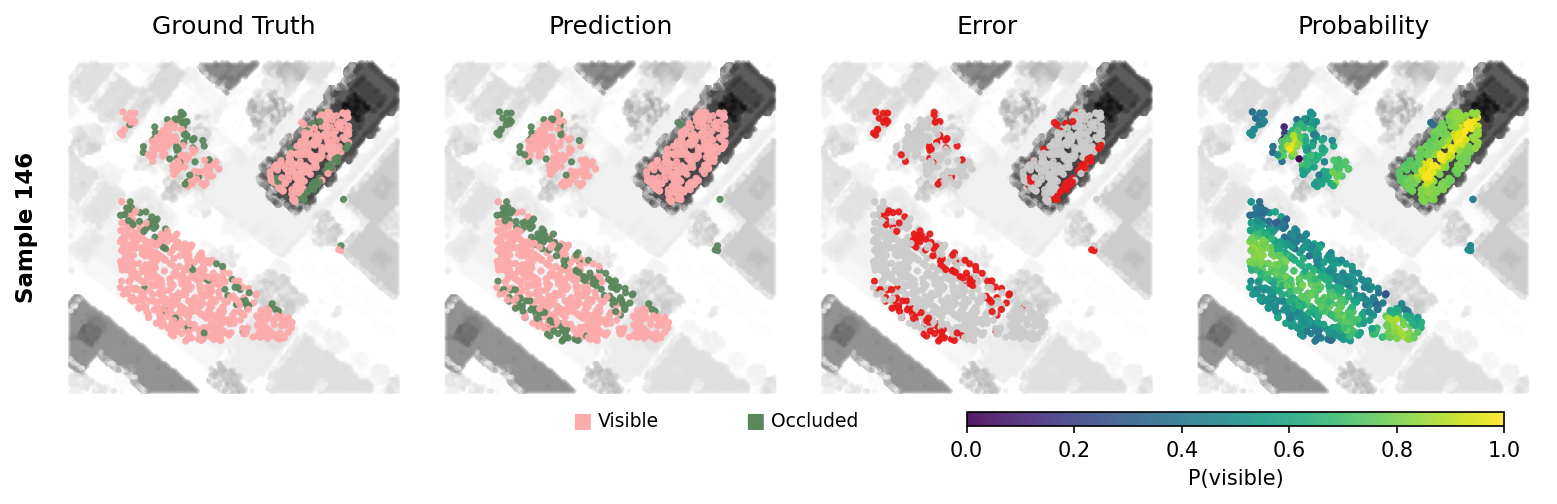
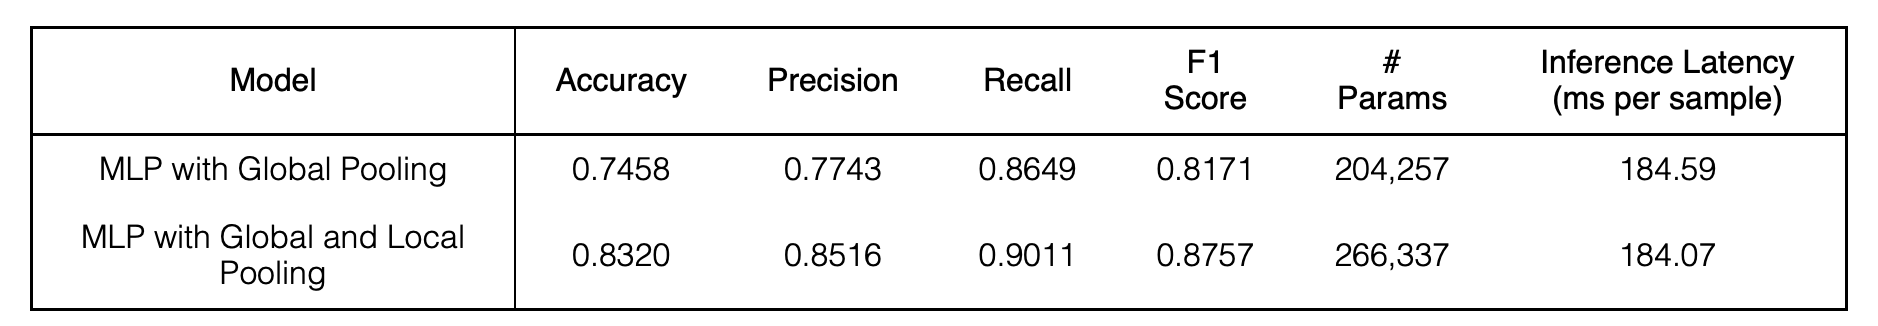
Step 3 - Incorporating Local Geometric Bias To address the model’s difficulty in capturing fine-grained geometric patterns, we introduce a local pooling branch inspired by PointNet++. In addition to global pooling, each test point aggregates features from its K nearest context neighbors using relative positional encoding and shared MLPs, producing a local descriptor that is combined with global and point-wise features for prediction. This local geometric bias significantly improves performance with minimal increase in parameters and no additional inference cost. Qualitative results show sharper probability maps and better recovery of small occluded regions, confirming that explicitly modeling local structure substantially enhances fine-detail prediction.
Bluebike Rebalancing
Multi-stage mixed-integer bike system optimization
Bluebike Rebalancing
Multi-stage mixed-integer bike system optimization - Final Report
2025 Fall, 6.C57J, MIT
Instructor: Alexandre Jacquillat, Saurabh Amin
Collaborator: Ray Law, Kara Chou
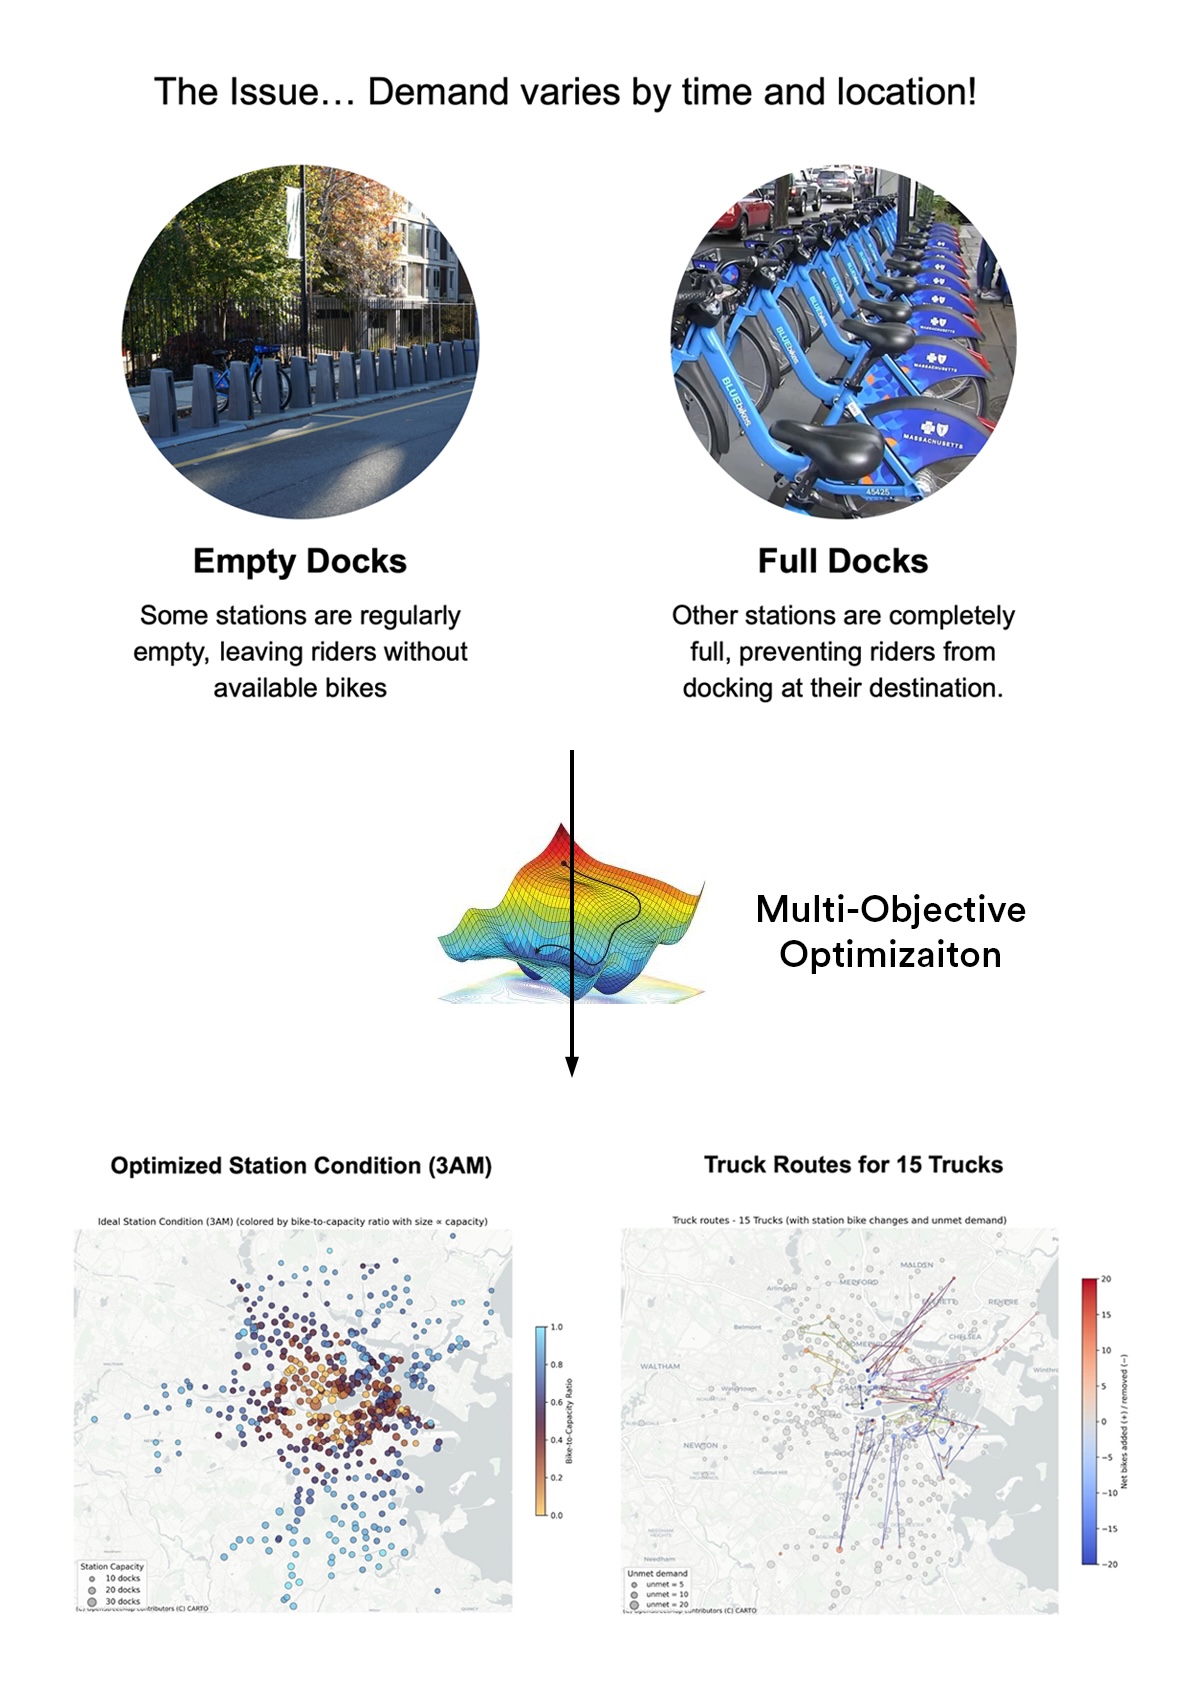
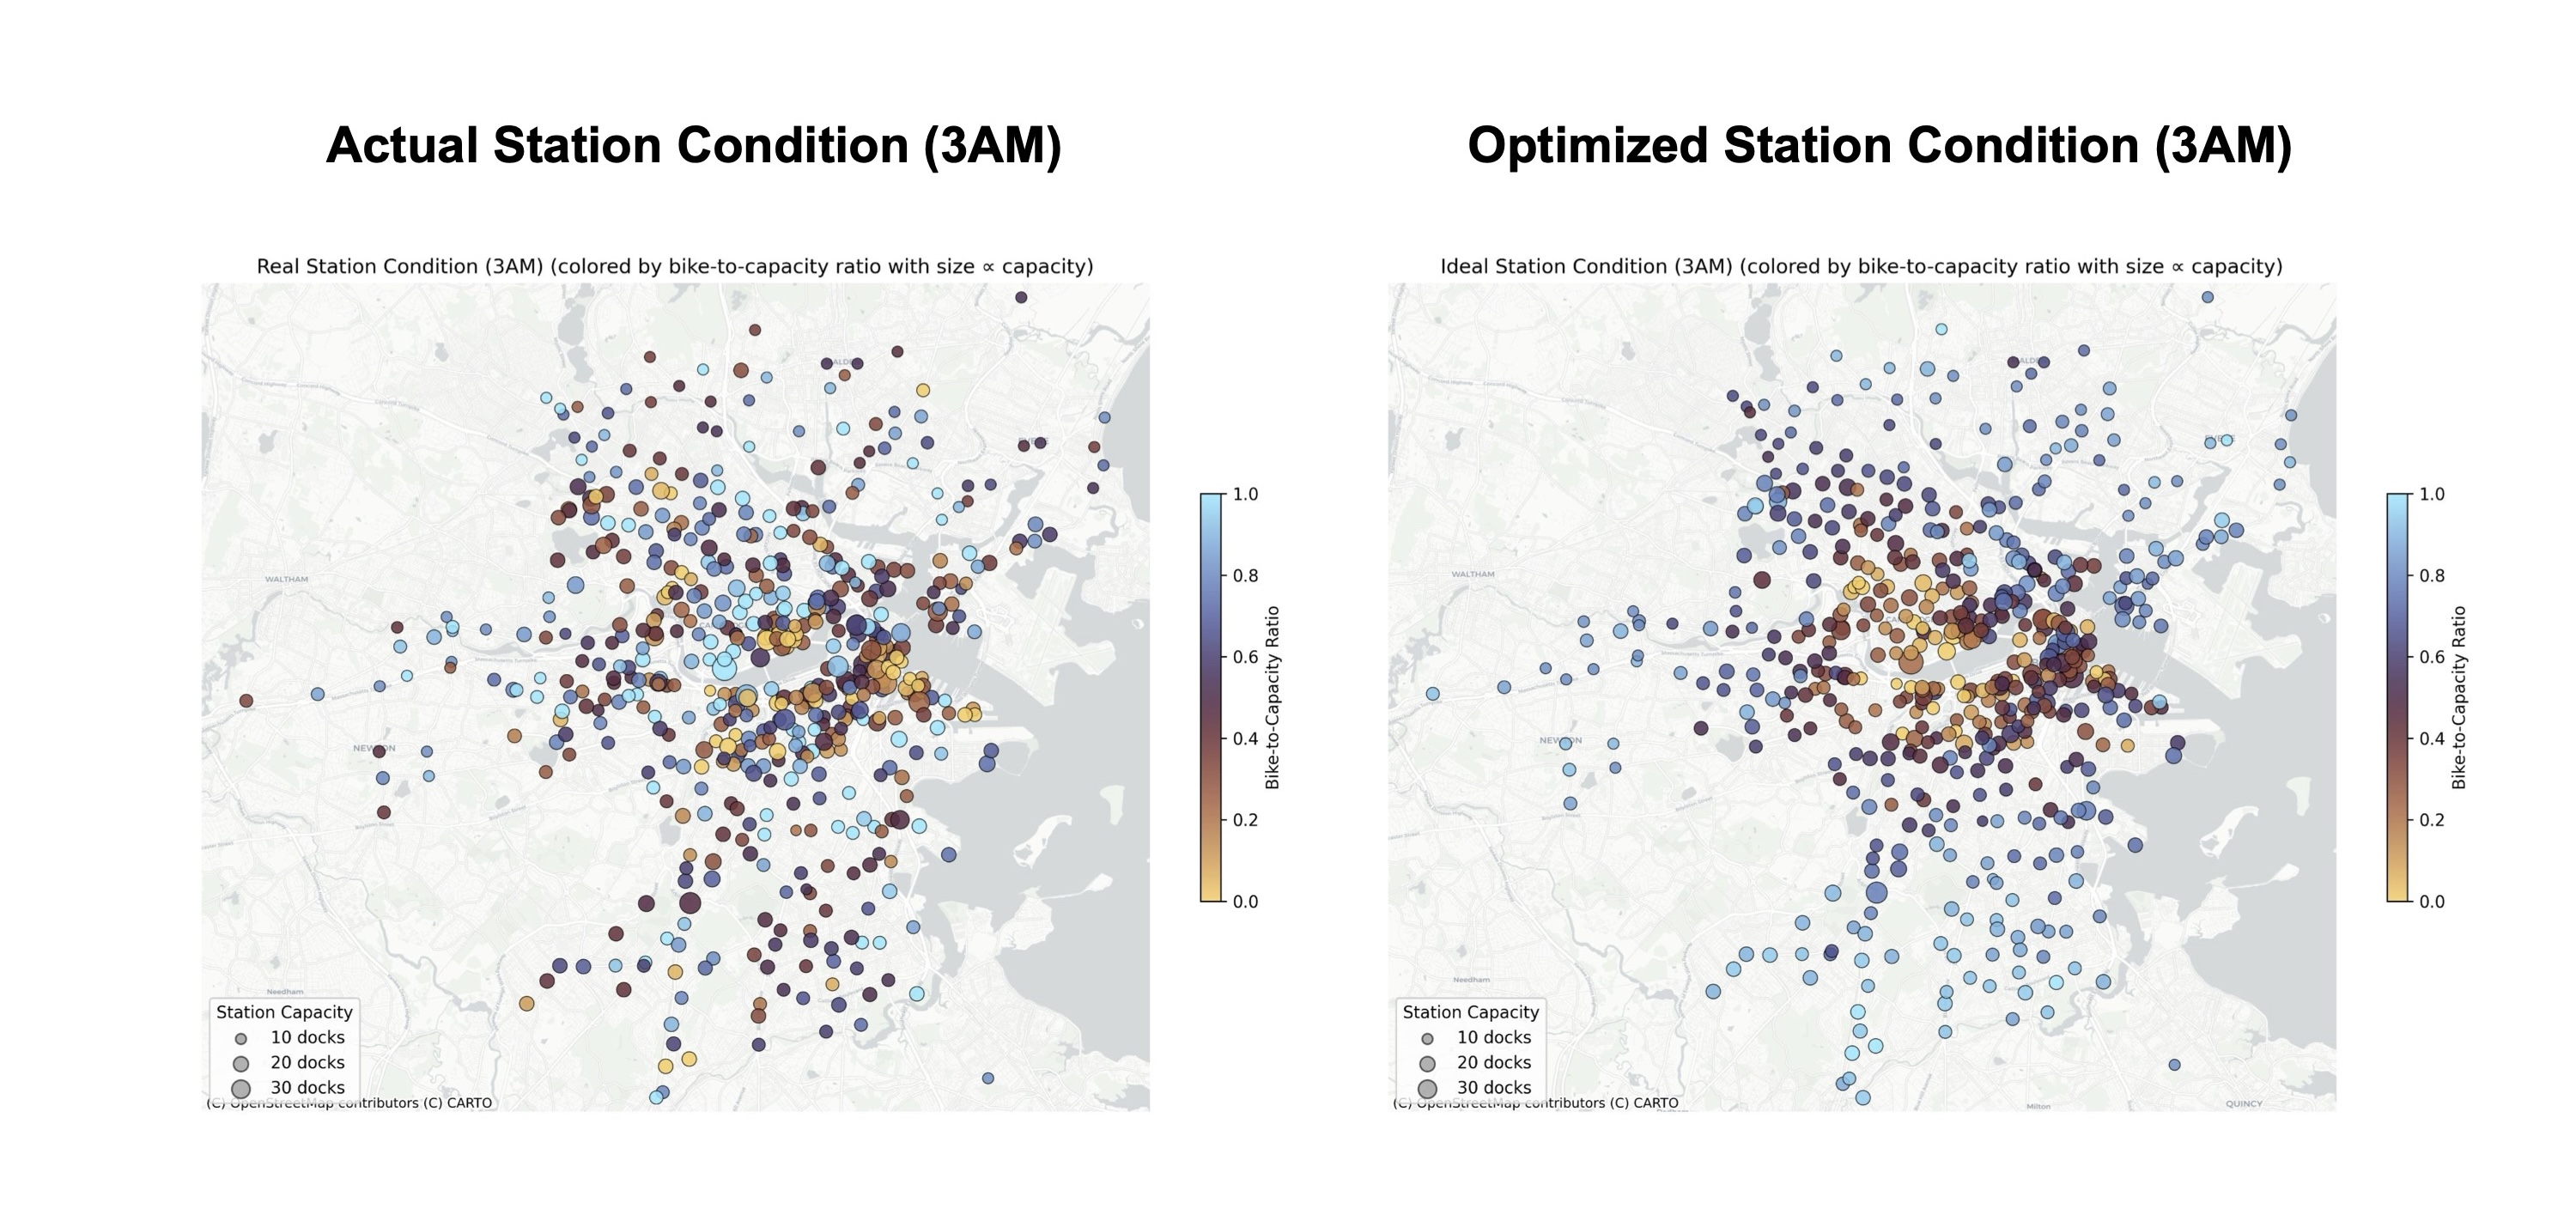
This project develops a predictive rebalancing strategy for the Bluebikes system in Greater Boston, which supports over 27 million trips across 600 stations and 5,500 bikes. Due to highly stochastic and spatially uneven demand, stations frequently become either empty or full, leading to user dissatisfaction and lost ridership. To address this, we formulate a two-stage optimization framework that determines optimal initial bike allocations and truck routing plans before daily operations begin. By leveraging historical demand data, the model minimizes unmet demand and rebalancing costs, providing a data-driven baseline schedule that improves system reliability while reducing operational inefficiencies.
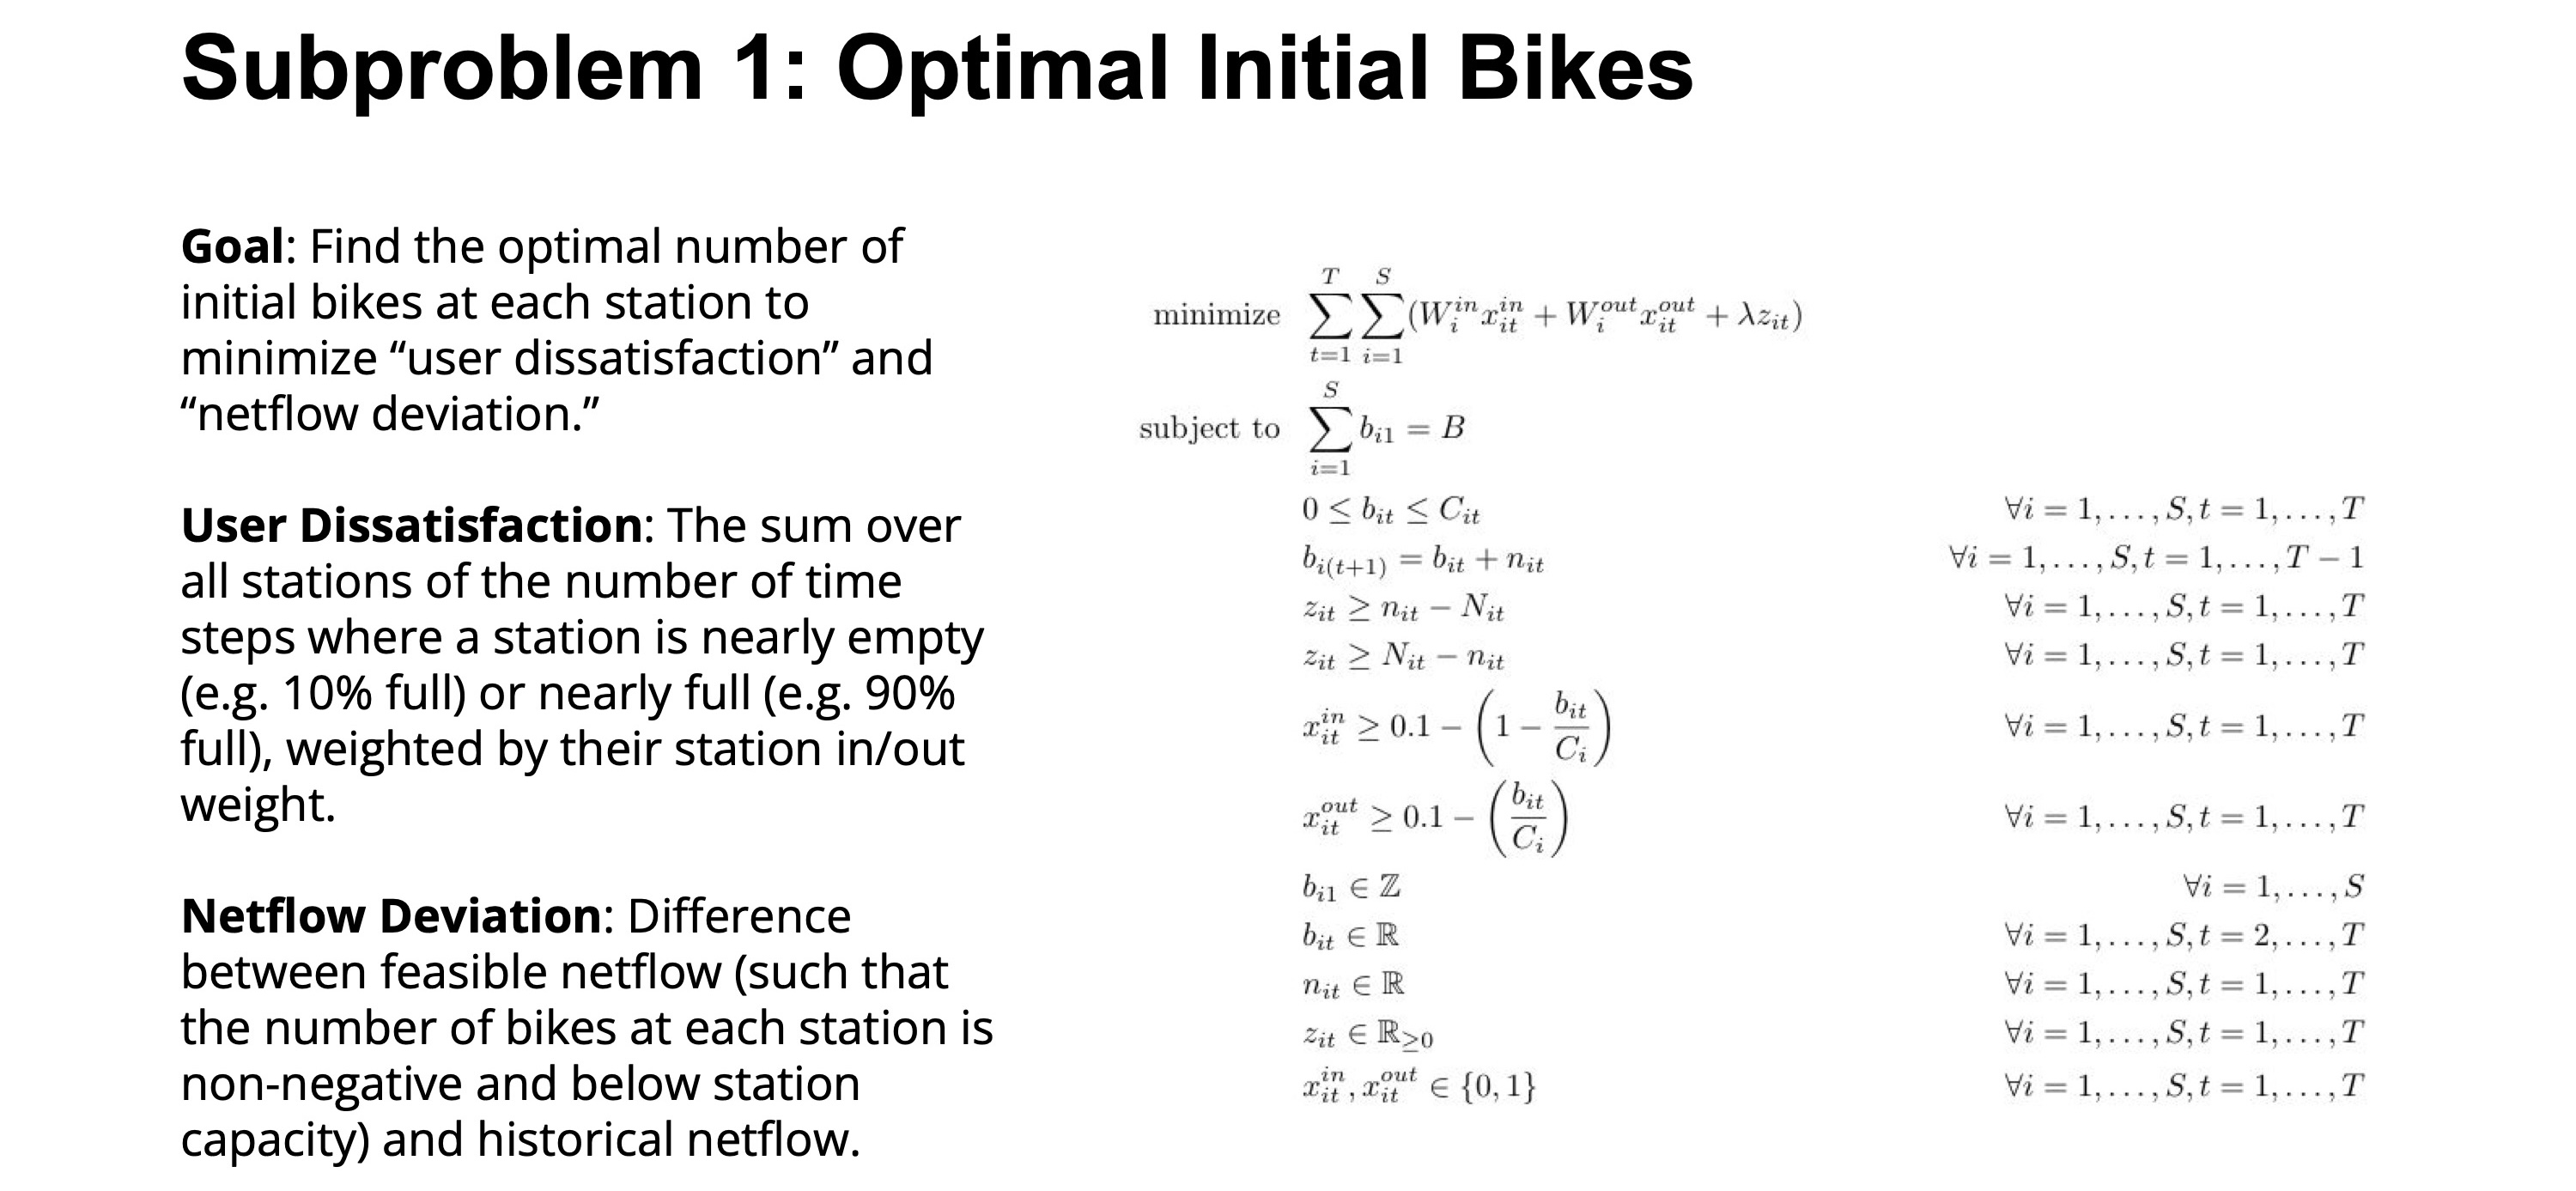
Subproblem 1 determines the optimal initial distribution of bikes across stations at the start of the day. The goal is to reduce user dissatisfaction—caused by stations becoming nearly empty or nearly full—while keeping bike flows consistent with expected demand patterns. The model allocates a fixed total number of bikes across stations, ensures that bike counts always stay within station capacity, and penalizes large deviations from forecasted net flows.
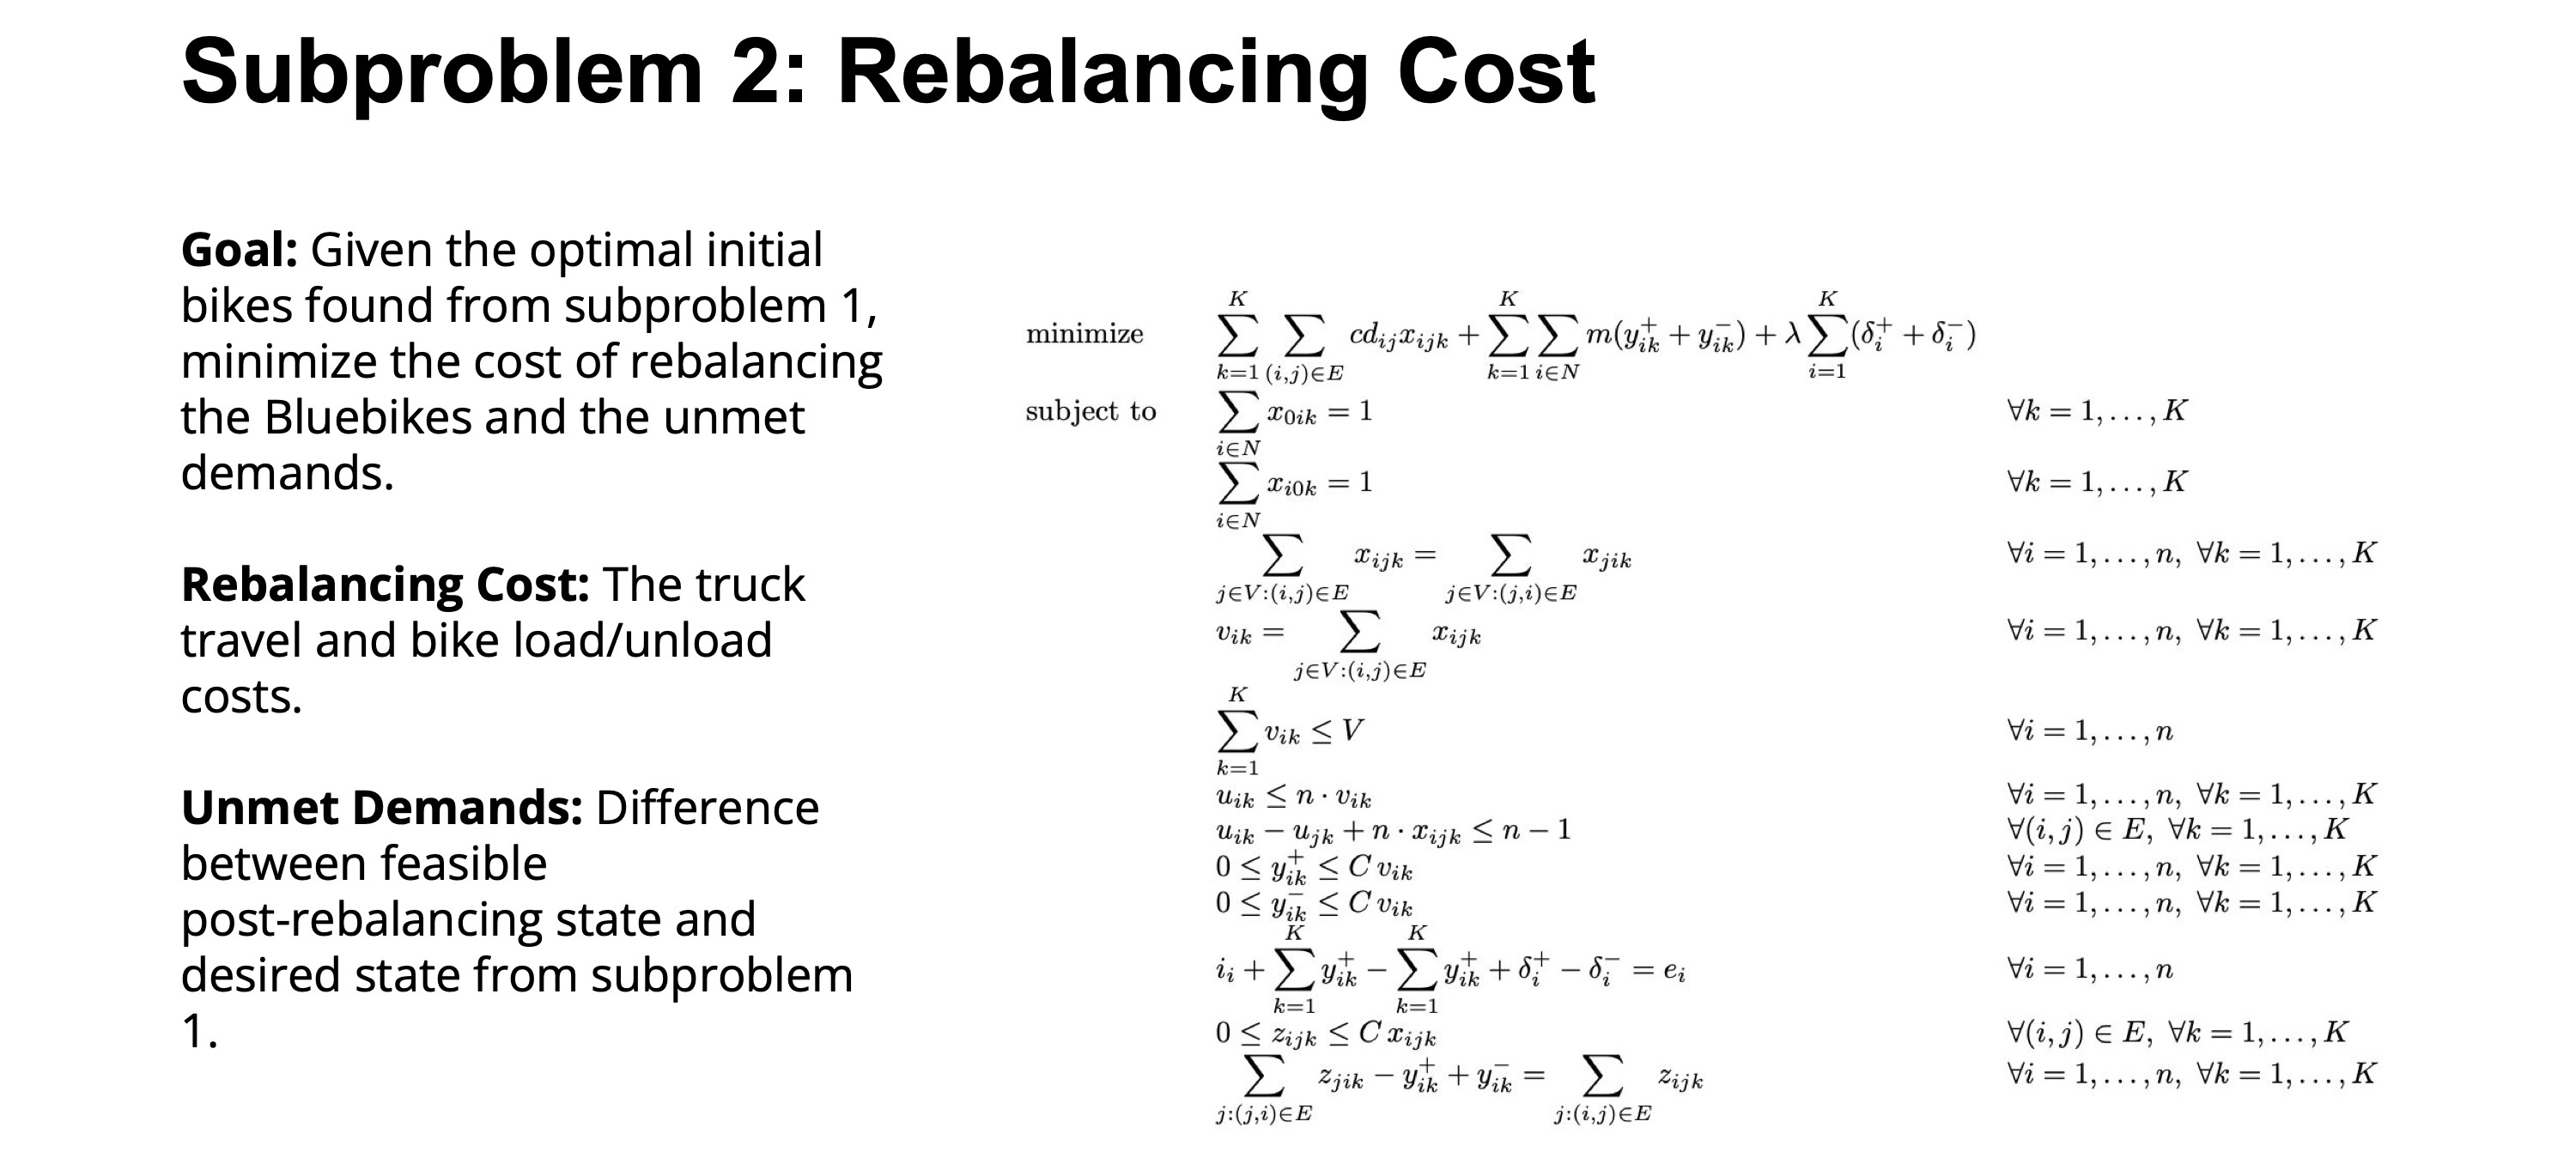
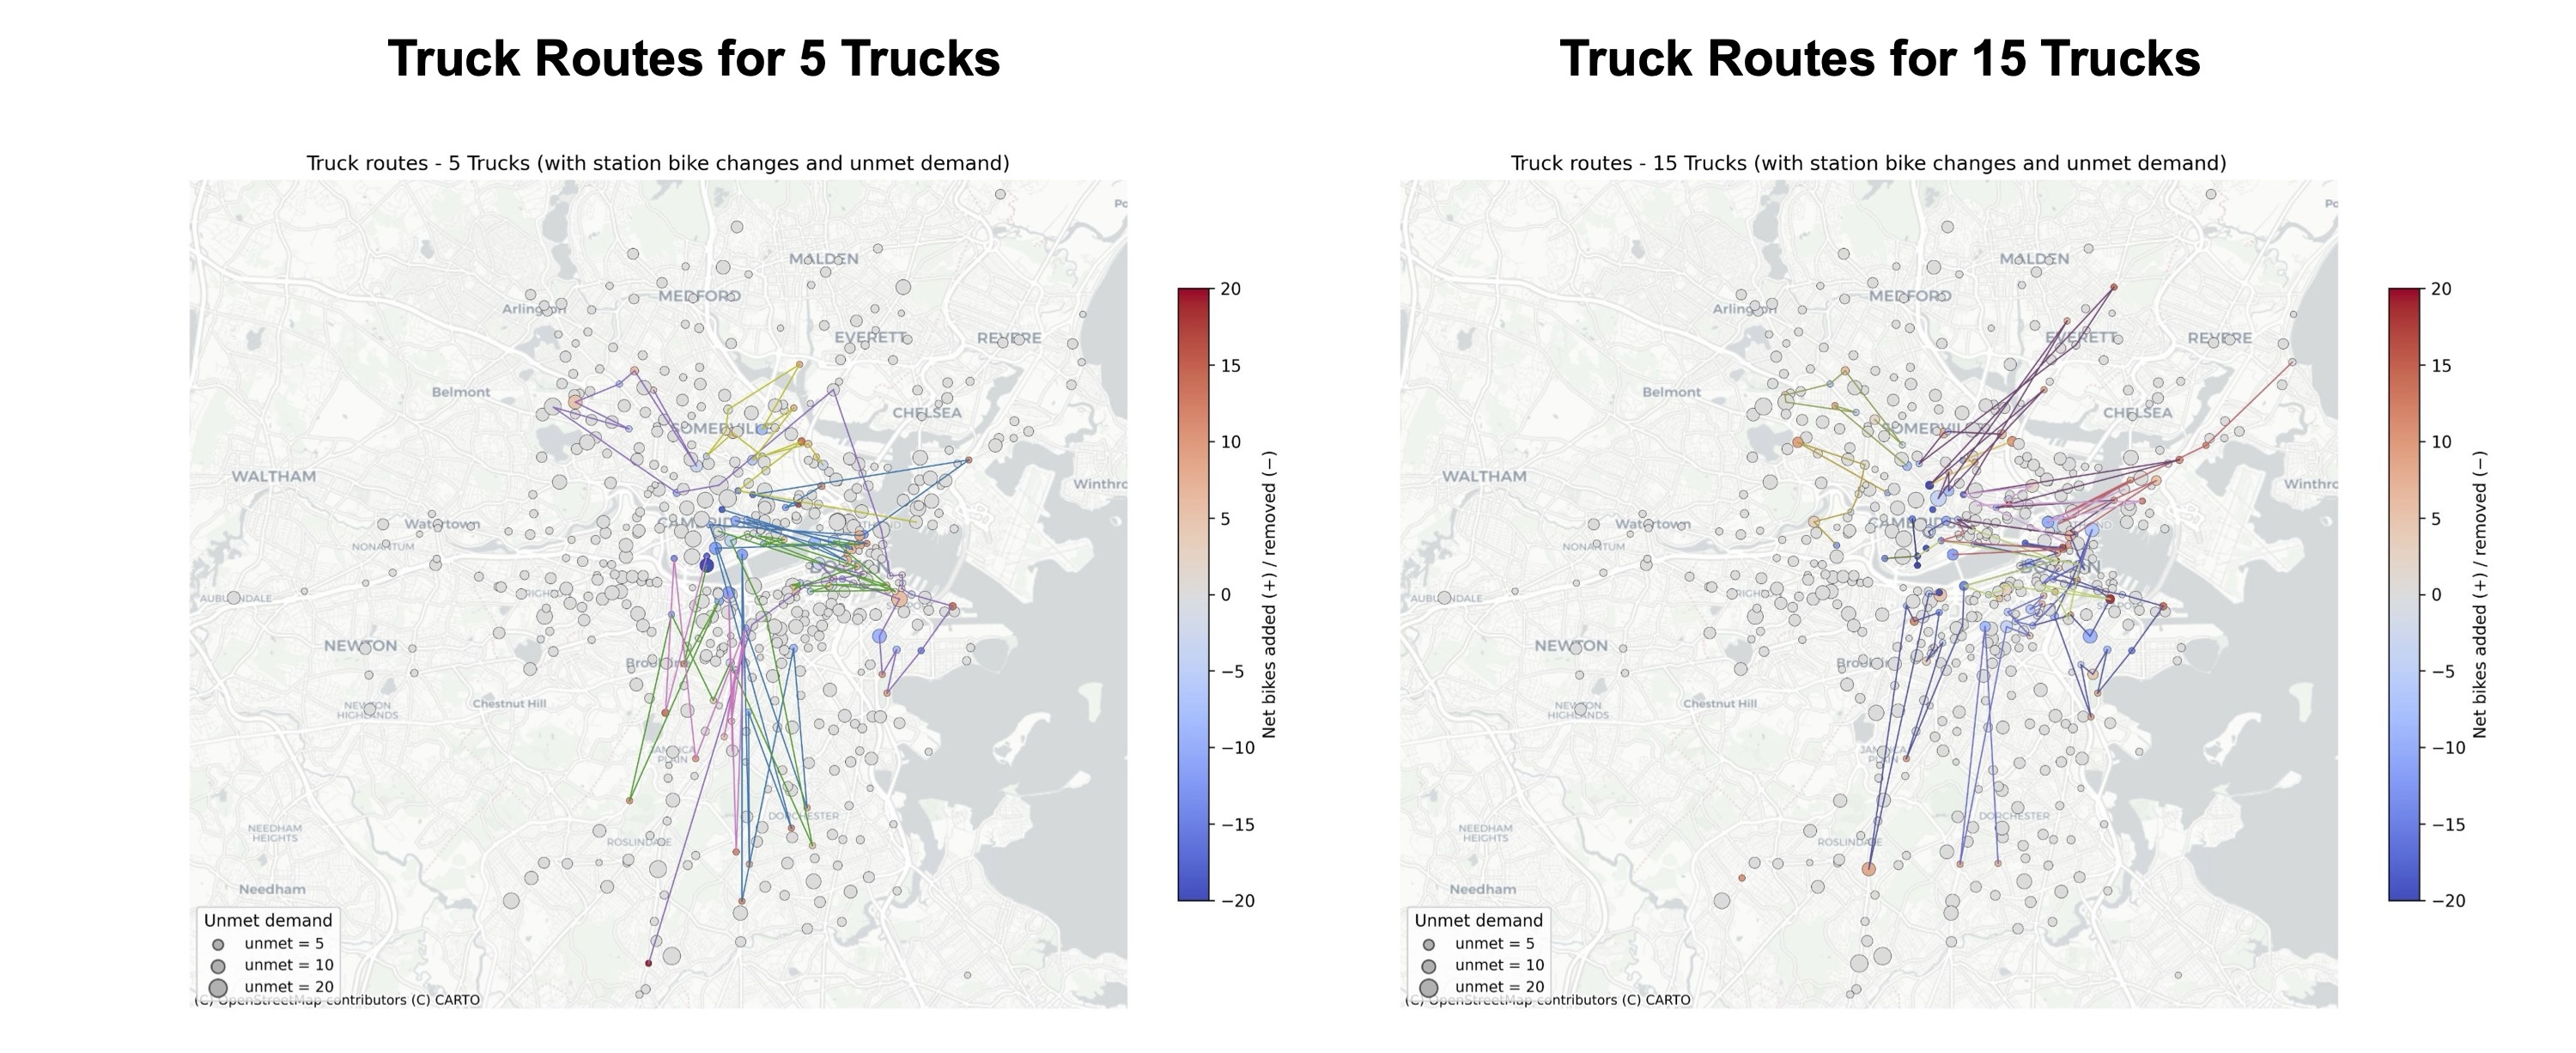
Subproblem 2 determines how to physically rebalance the system to achieve the target bike distribution computed in Subproblem 1. We model the network as a routing problem in which a limited fleet of trucks picks up and drops off bikes across stations. The optimization jointly decides truck routes and loading actions to move the system as close as possible to the desired inventory levels, while minimizing travel distance, handling costs, and unmet targets.
Weather Analysis
Data visualization project
Weather Analysis
Data Visualization Built using d3.js - GitHub Link
2024 Fall, Cornell University, INFO 3300
Instructor: Jeff Rzeszotarski
Collaborator: Curtis Xu, Chi Zhang
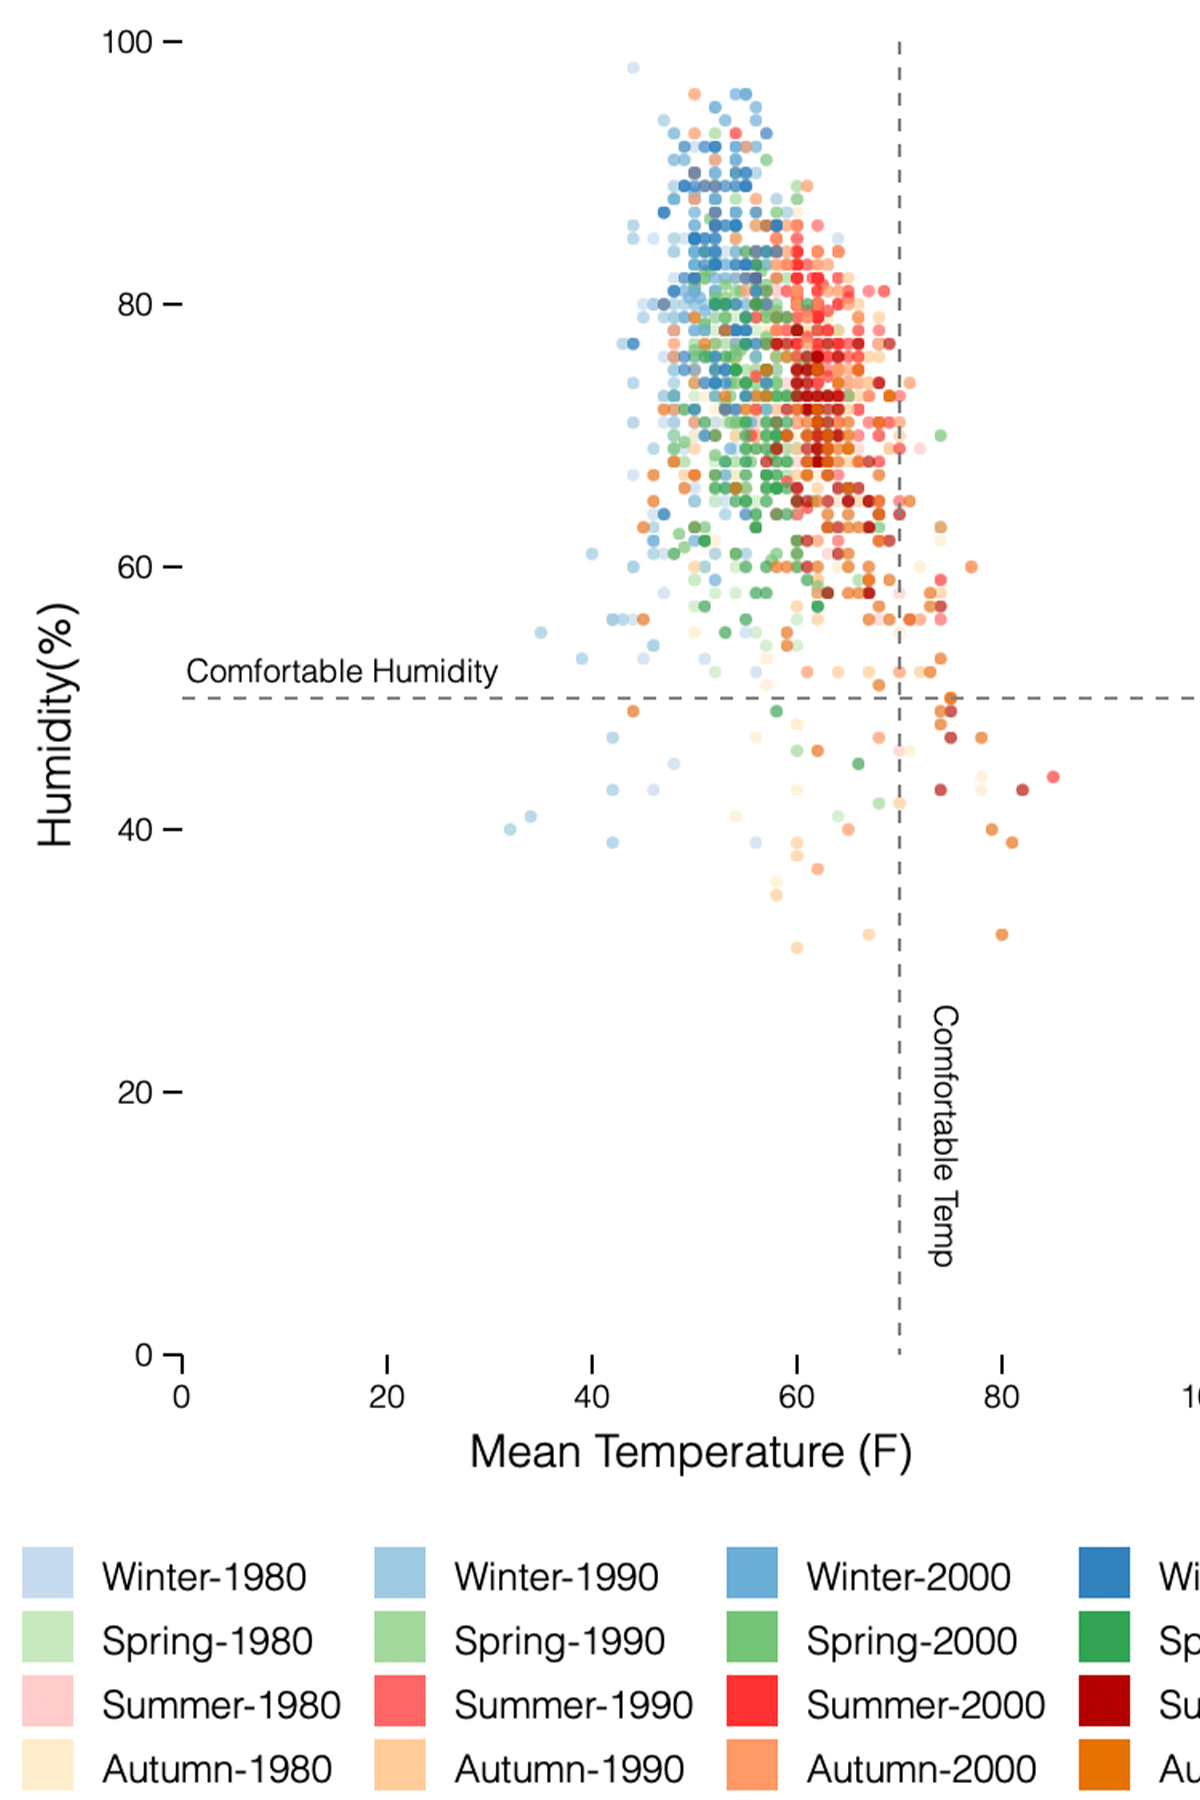
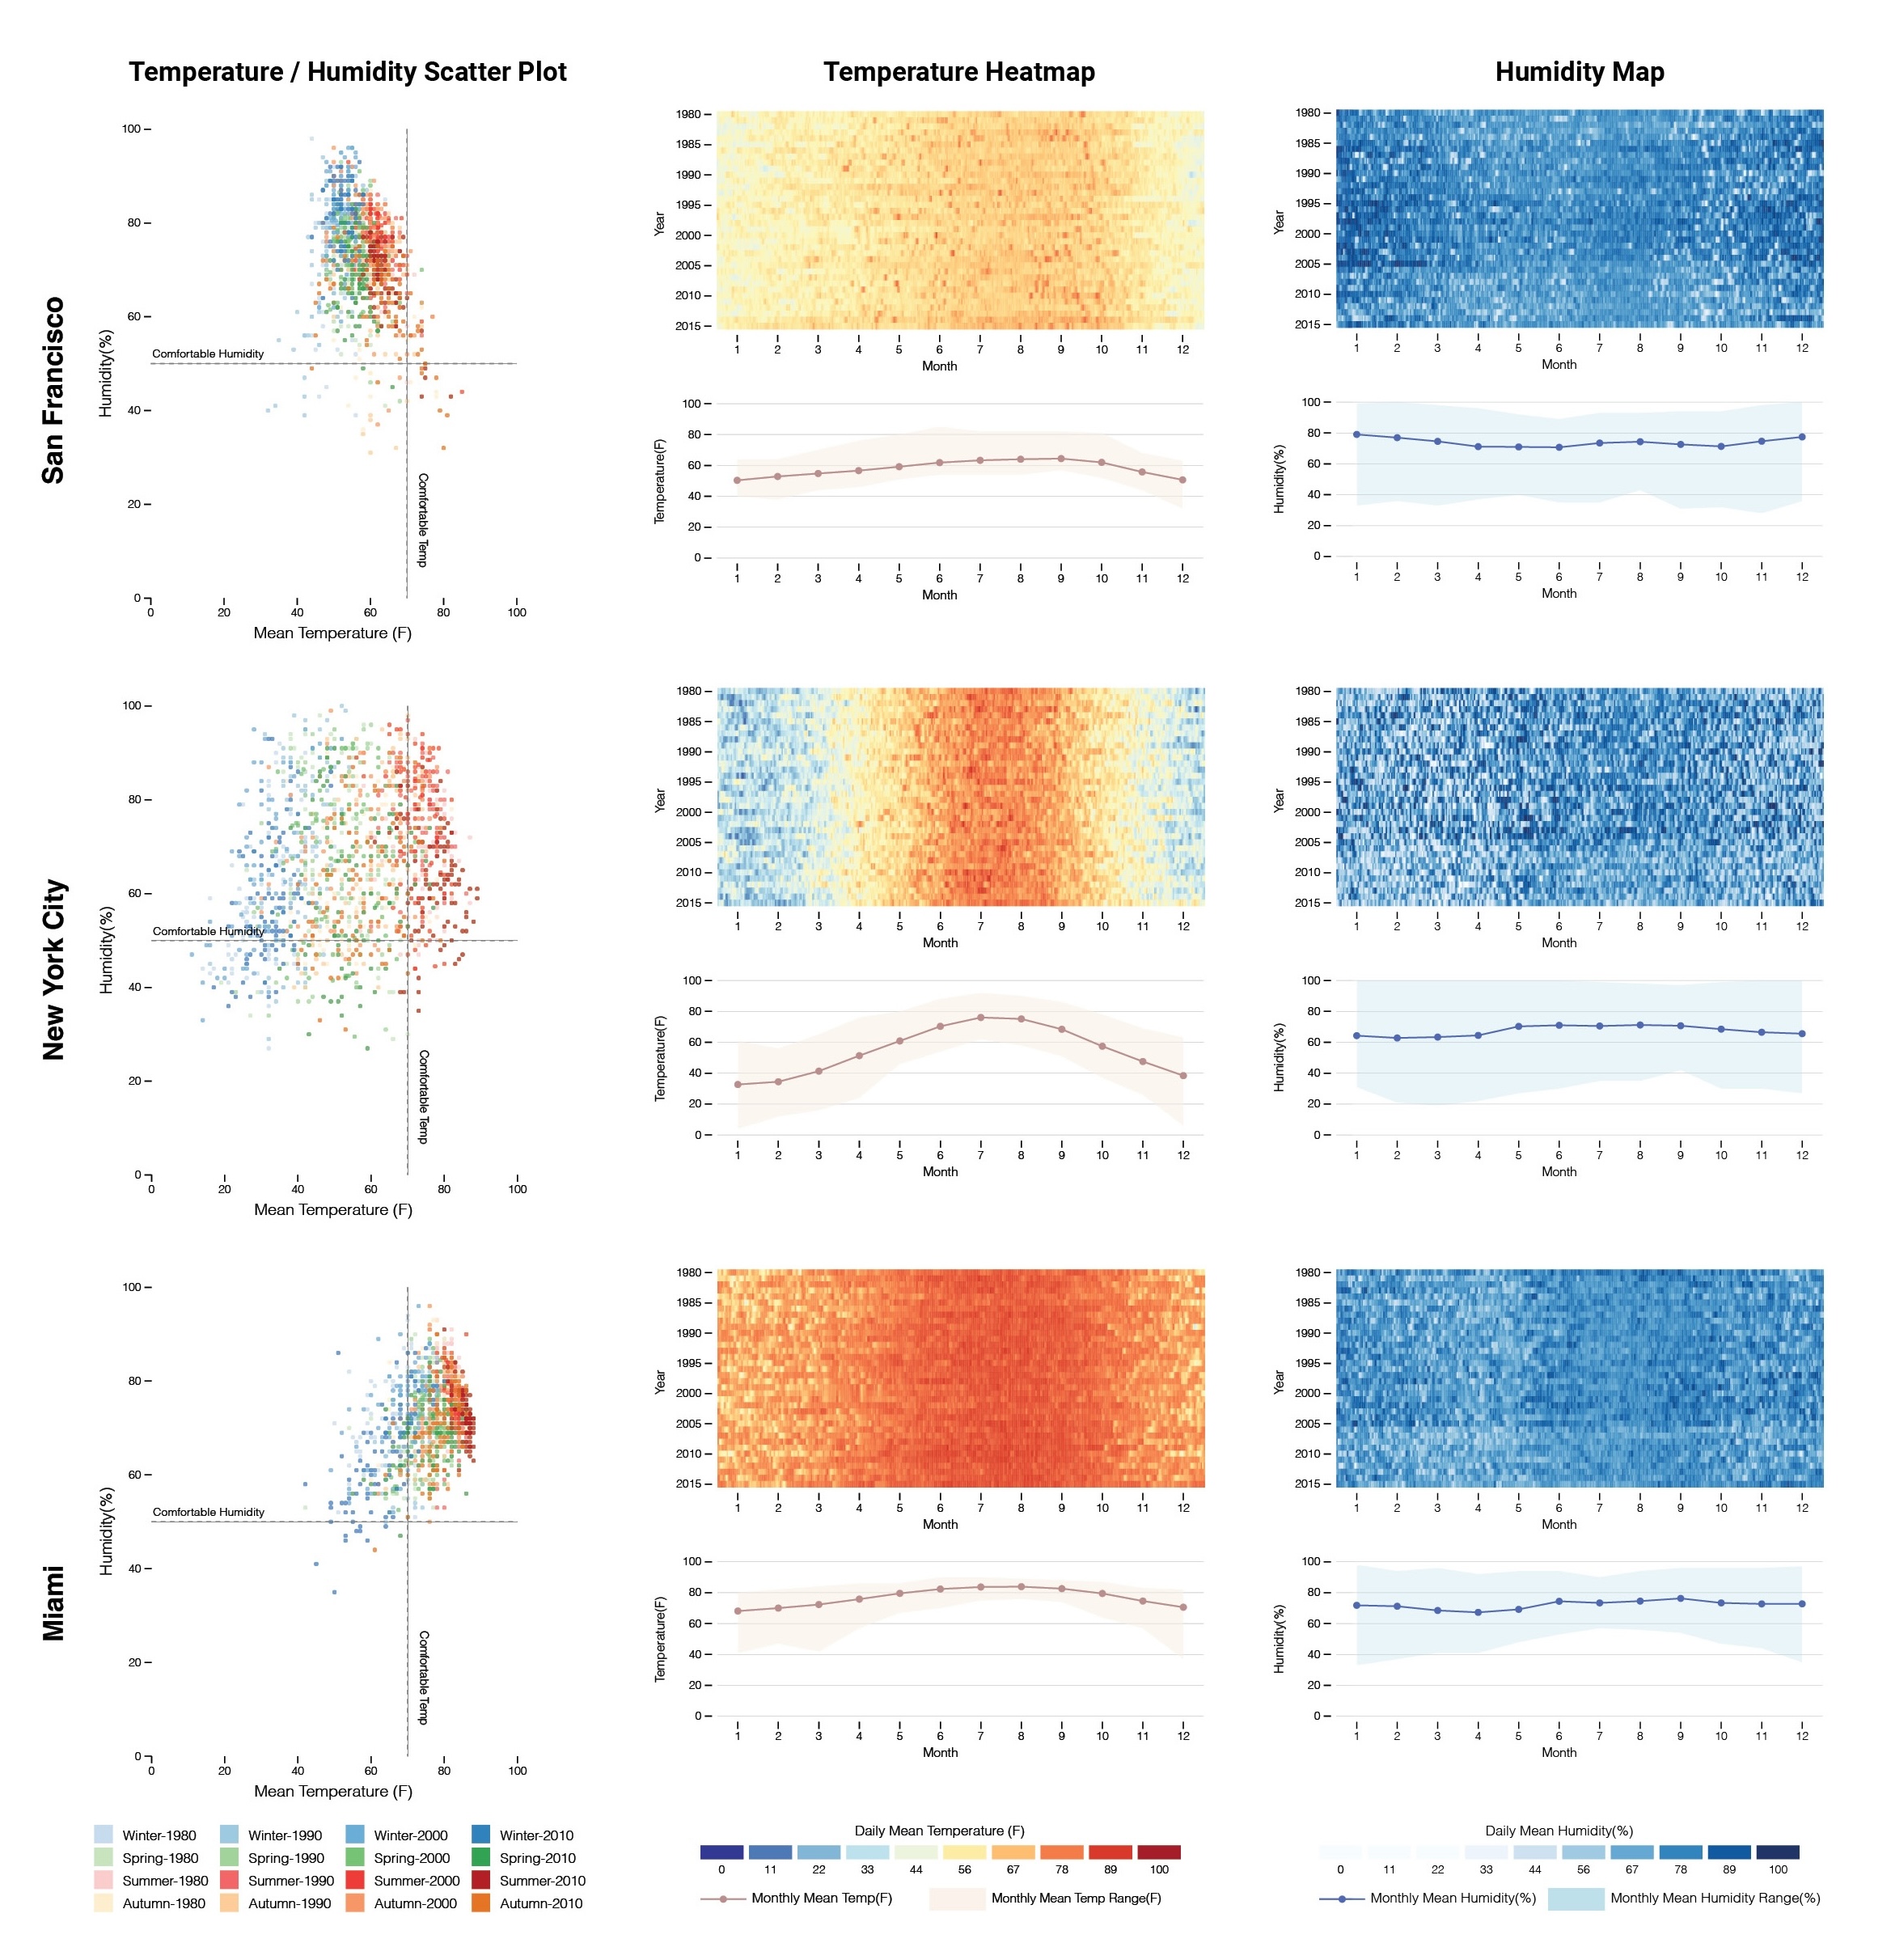
This project aims to visualize weather patterns and changes over time in various cities, focusing on temperature and humidity trends from 1980 to 2015. By examining chronological shifts across different climate zones, it seeks to reveal potential relationships between temperature and humidity while identifying distinct patterns of variation. Through clear and intuitive visualizations, the project aims to highlight climate adaptation over the years.
CBECS | RECS Dashboard
Interactive data visualization project
CBECS | RECS Dashboard
Interactive Data Visualization Built using d3.js - GitHub Link
2024 Fall, Cornell University, INFO 3300
Instructor: Jeff Rzeszotarski
Collaborator: Curtis Xu, Chi Zhang
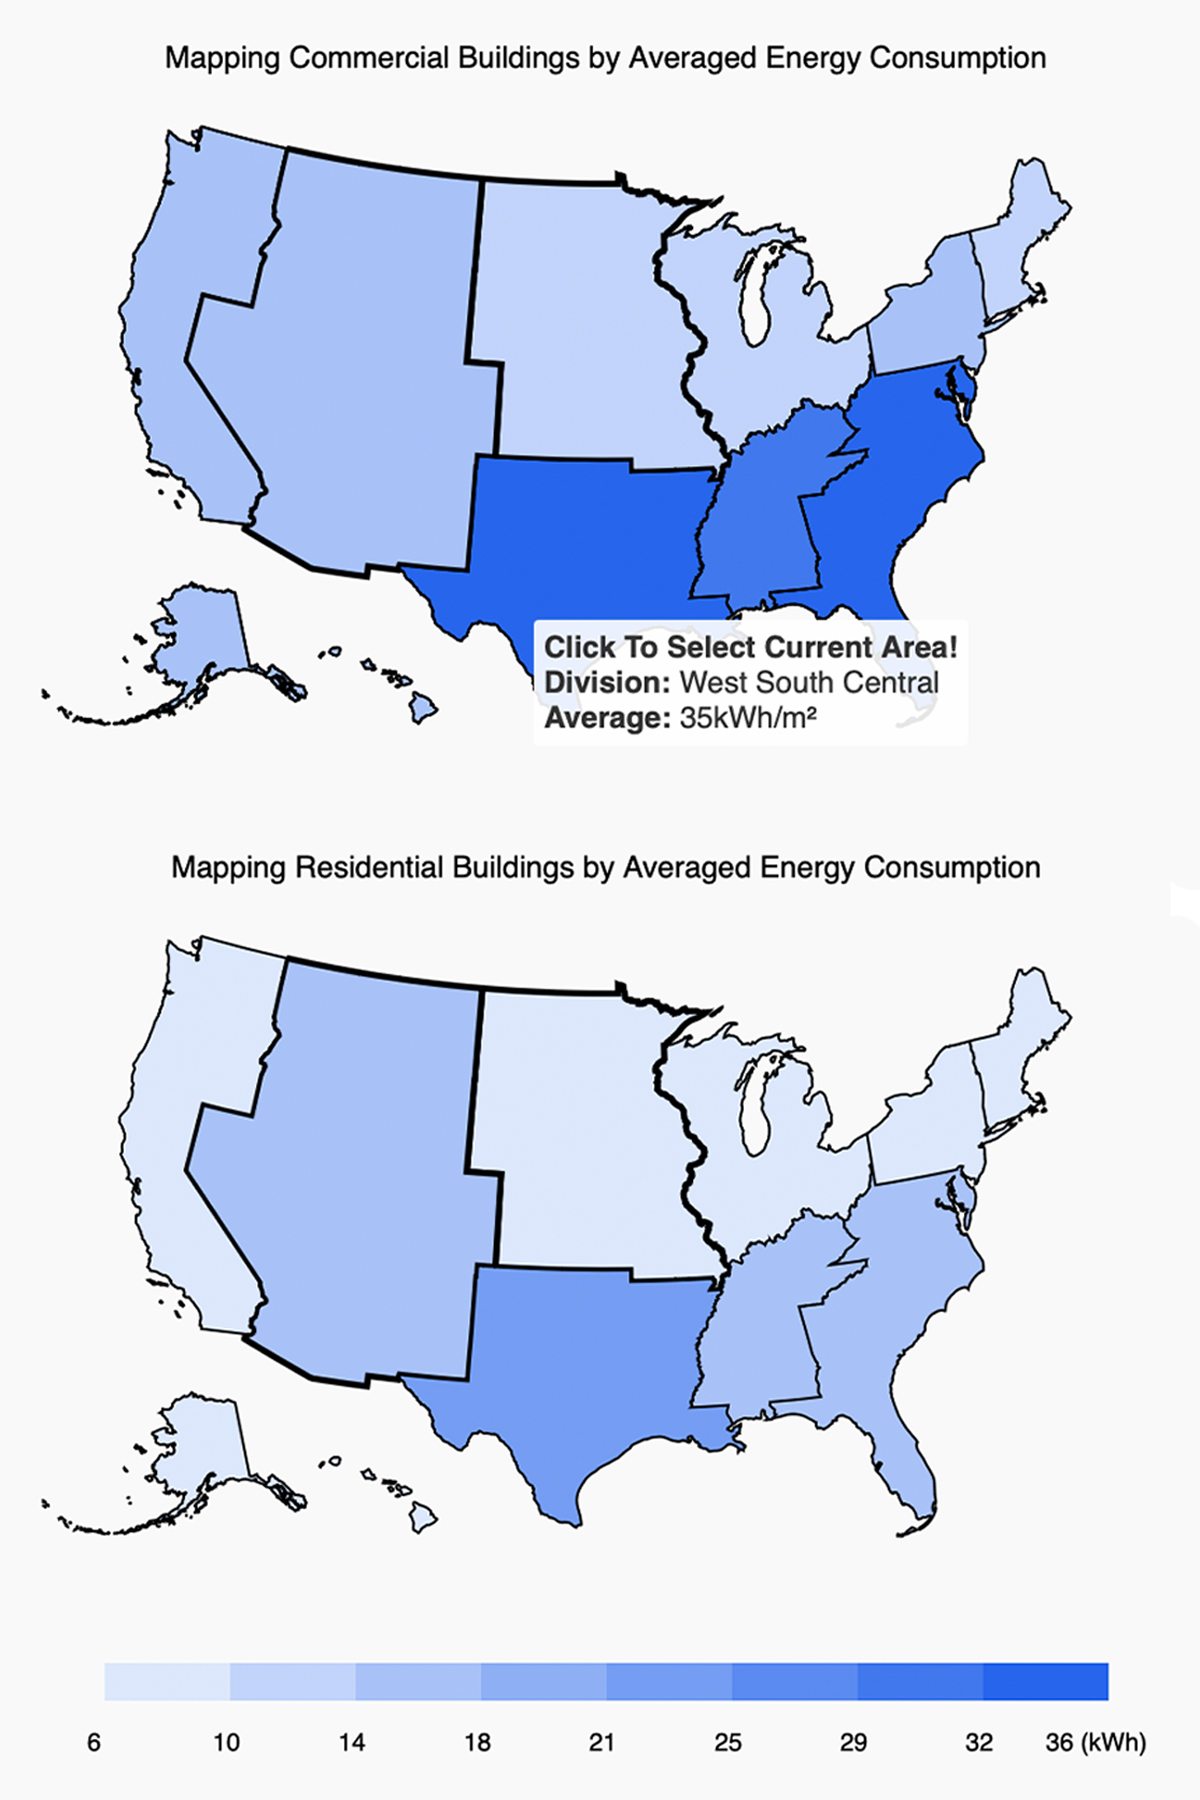
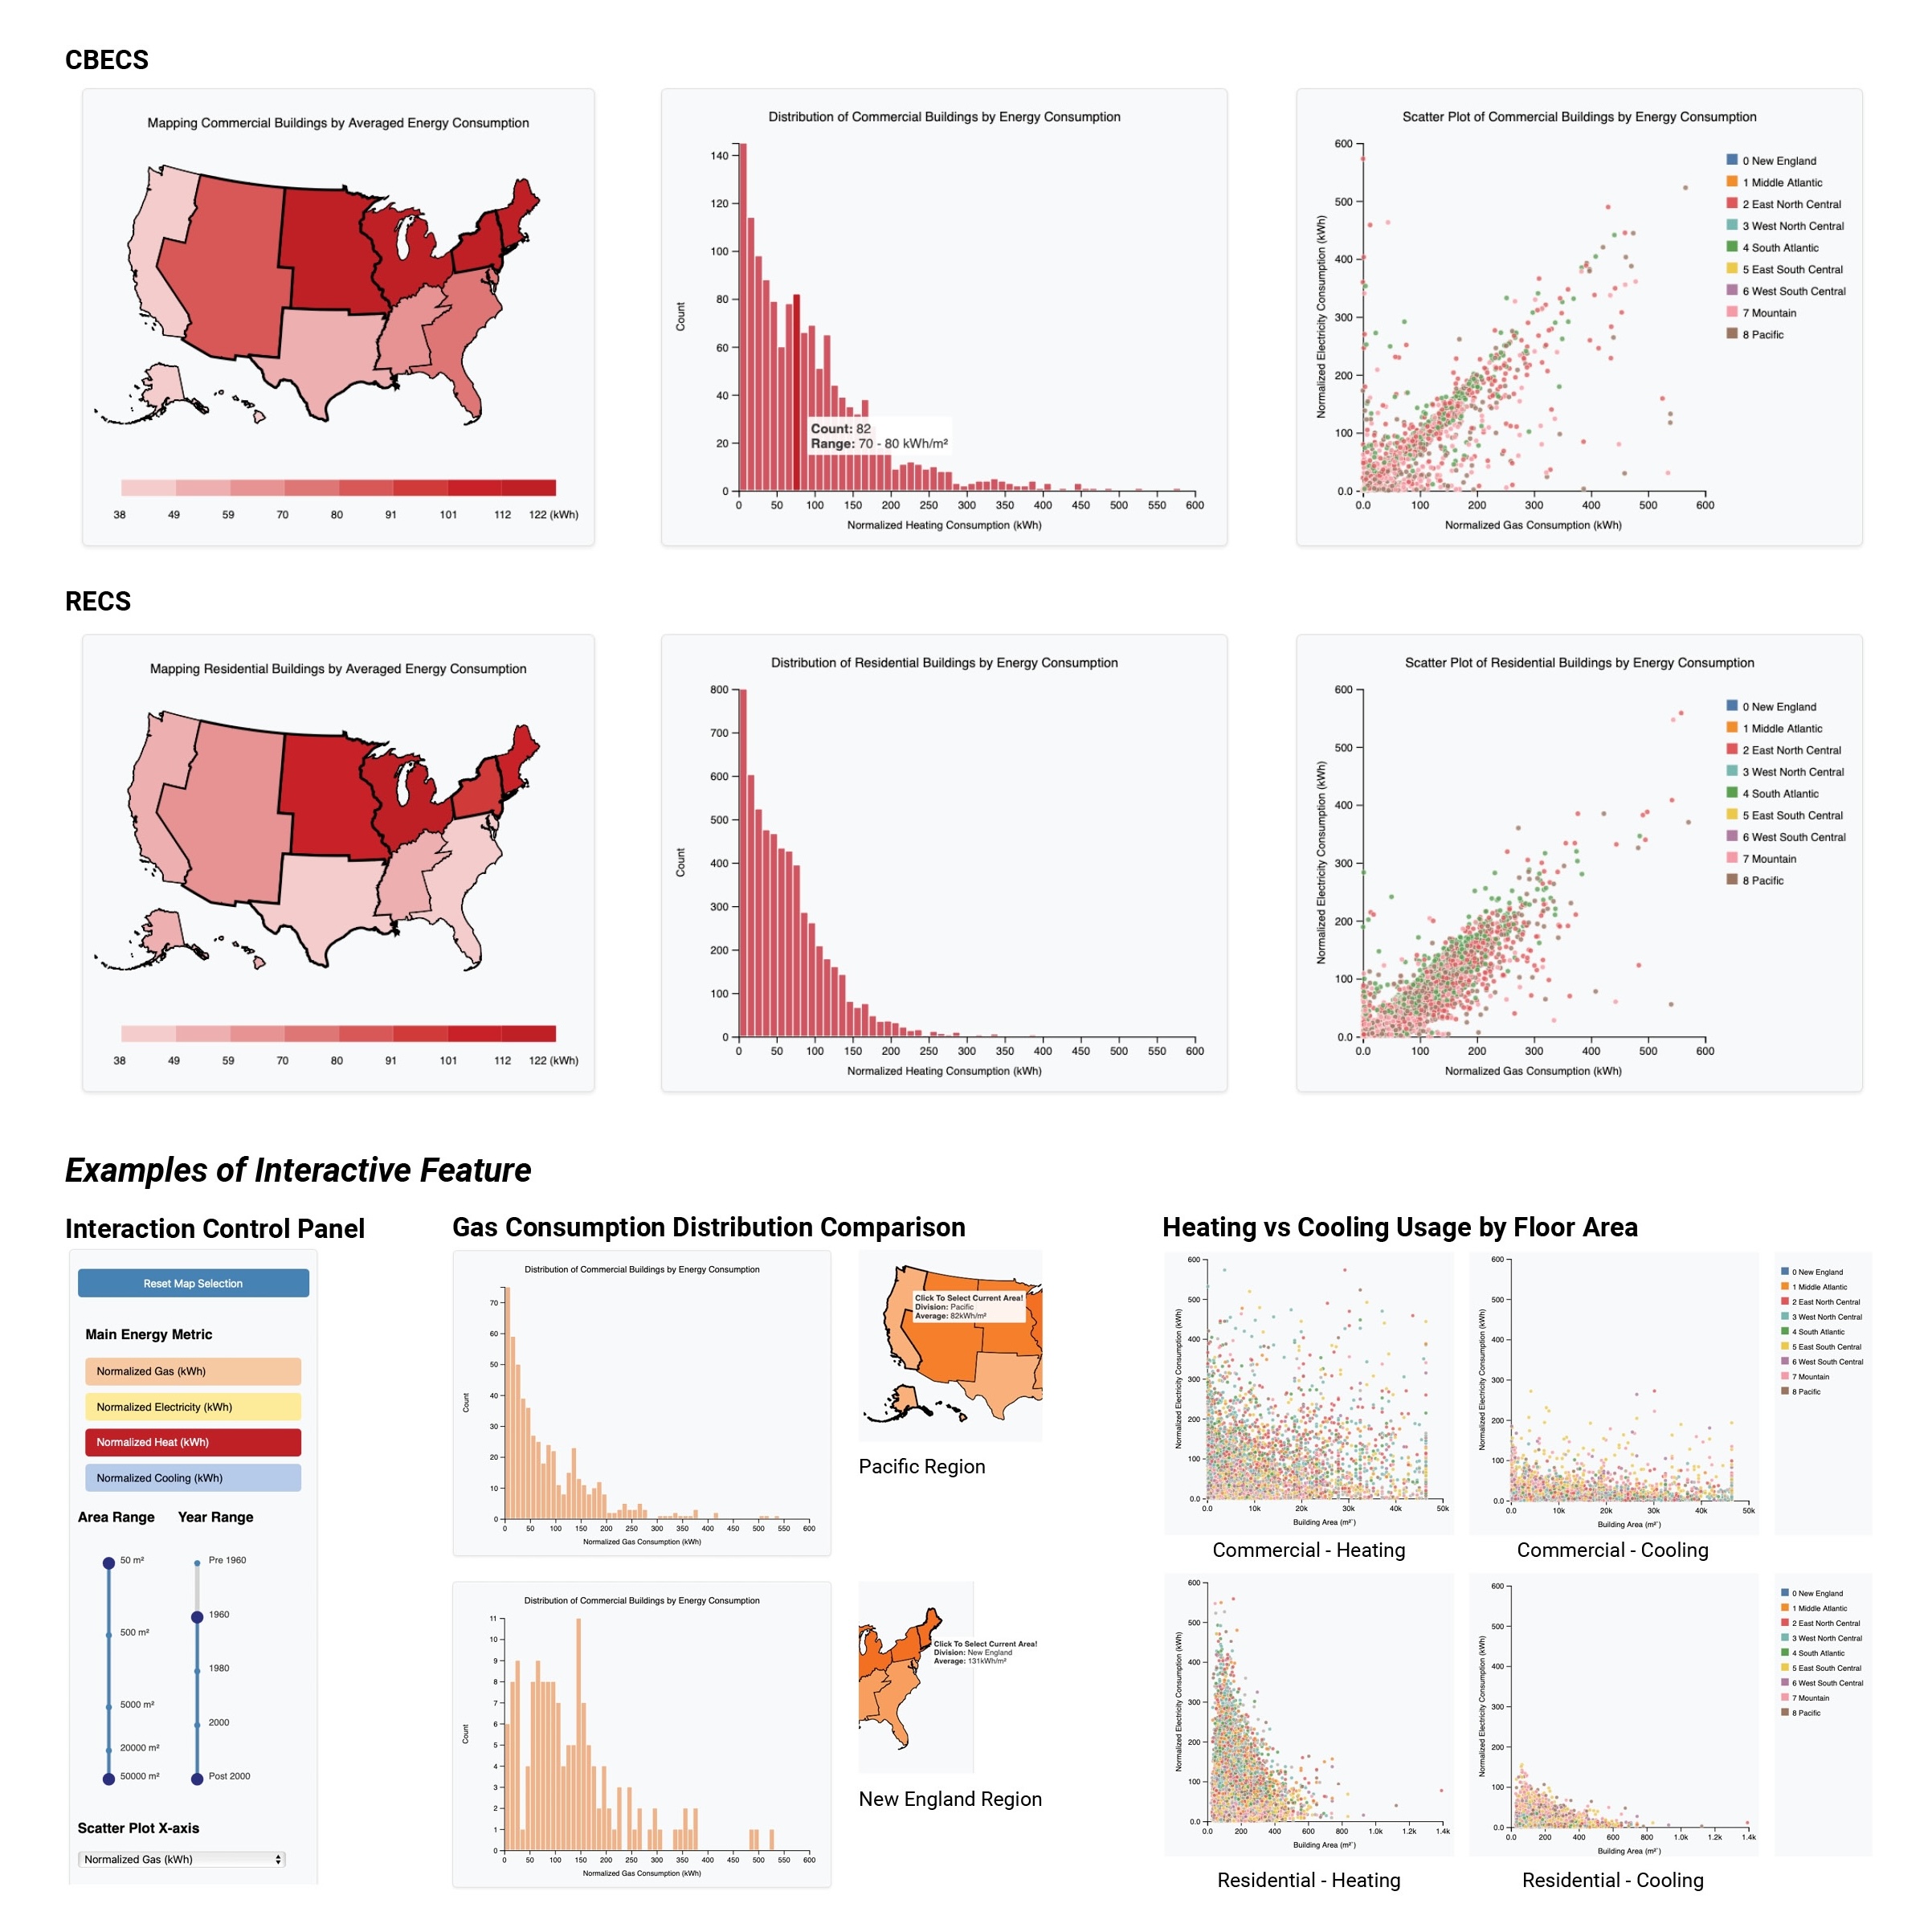
This visualization is built on data from the Commercial Buildings Energy Consumption Survey (CBECS) and Residential Energy Consumption Survey (RECS). It aims to analyze building energy usage patterns across construction years, building sizes, and regions, offering insights into gas, electricity, heating, and cooling consumption. By examining the implications of building characteristics on energy usage, the project presents a series of visualizations with interactive filters, enabling users to explore and better understand energy consumption trends in both residential and commercial buildings.
Scan-to-Assessment
Scan-to-simulation for property assessment
Scan-to-Assessment
AEC Tech Hack 2024, NYC - GitHub Link
Team Project
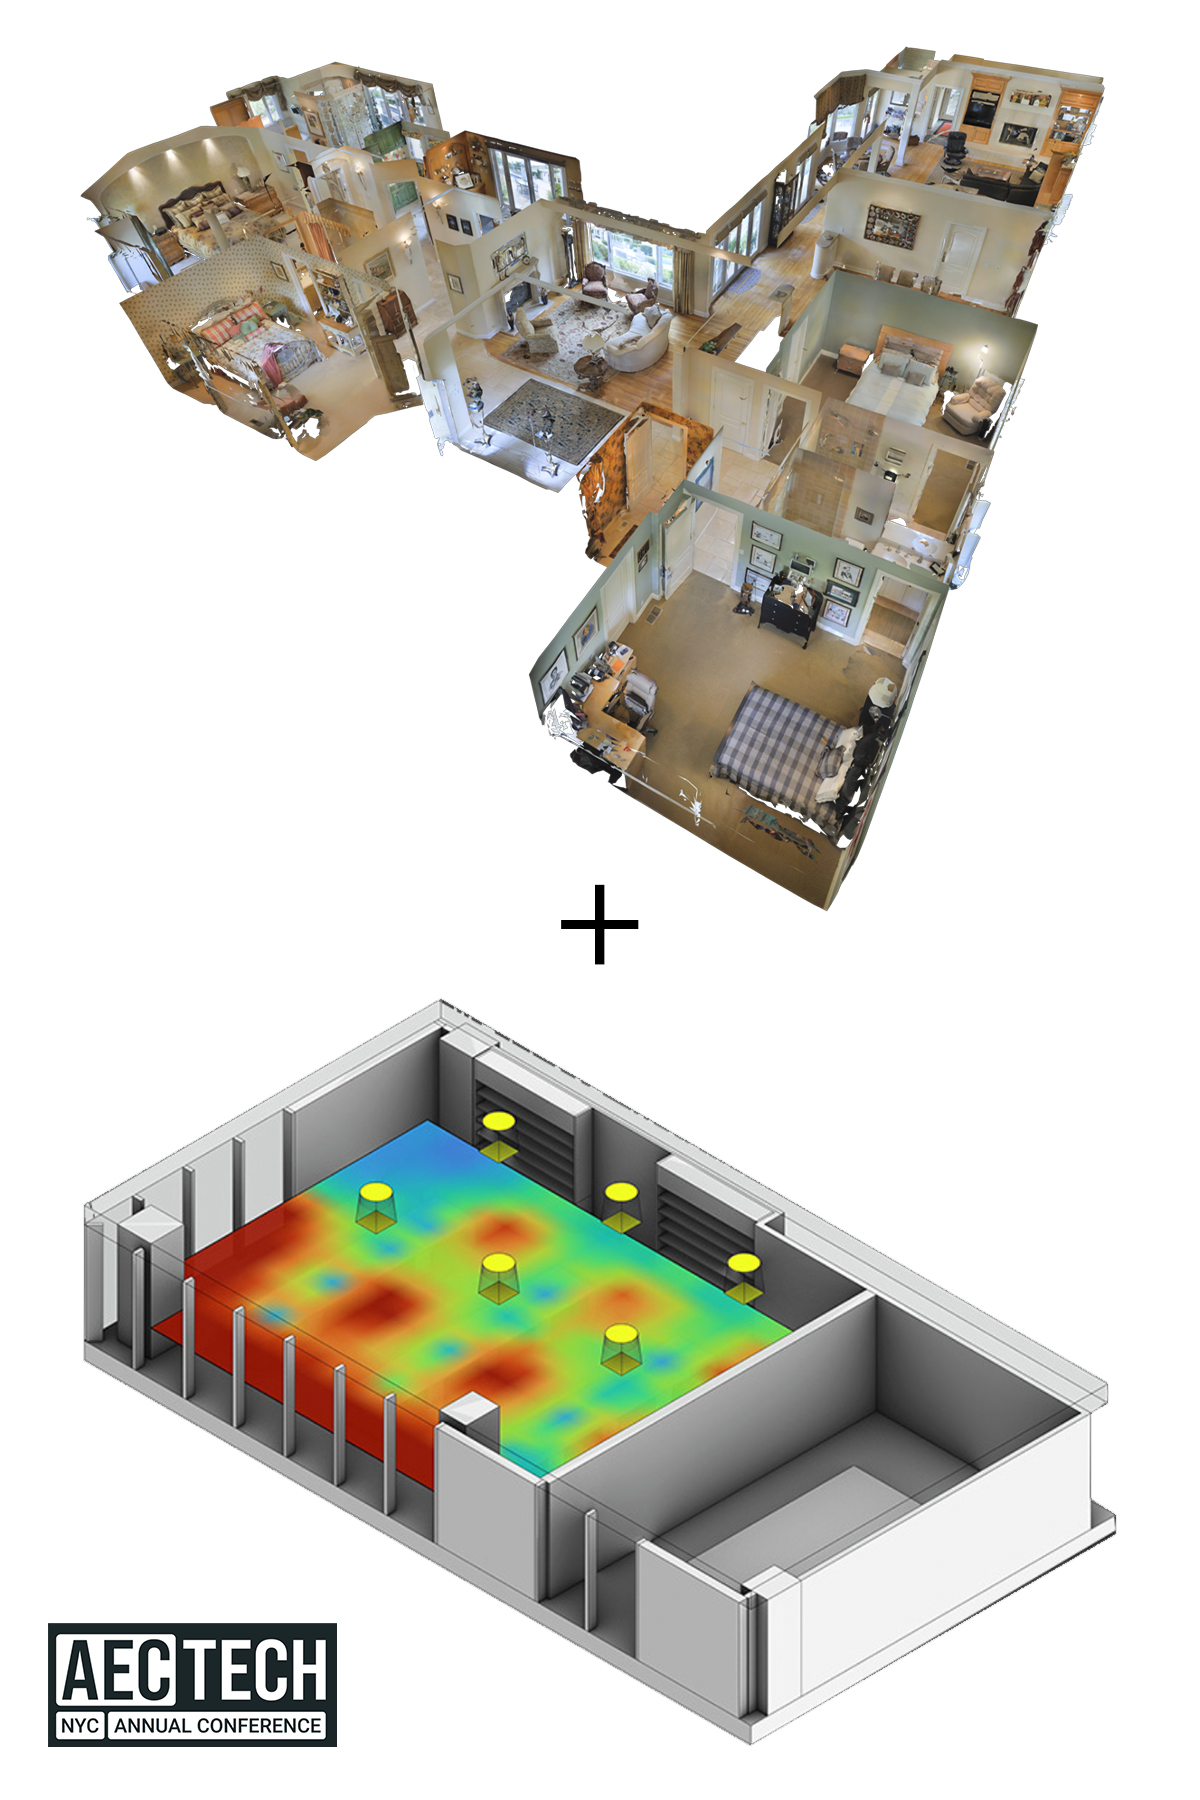
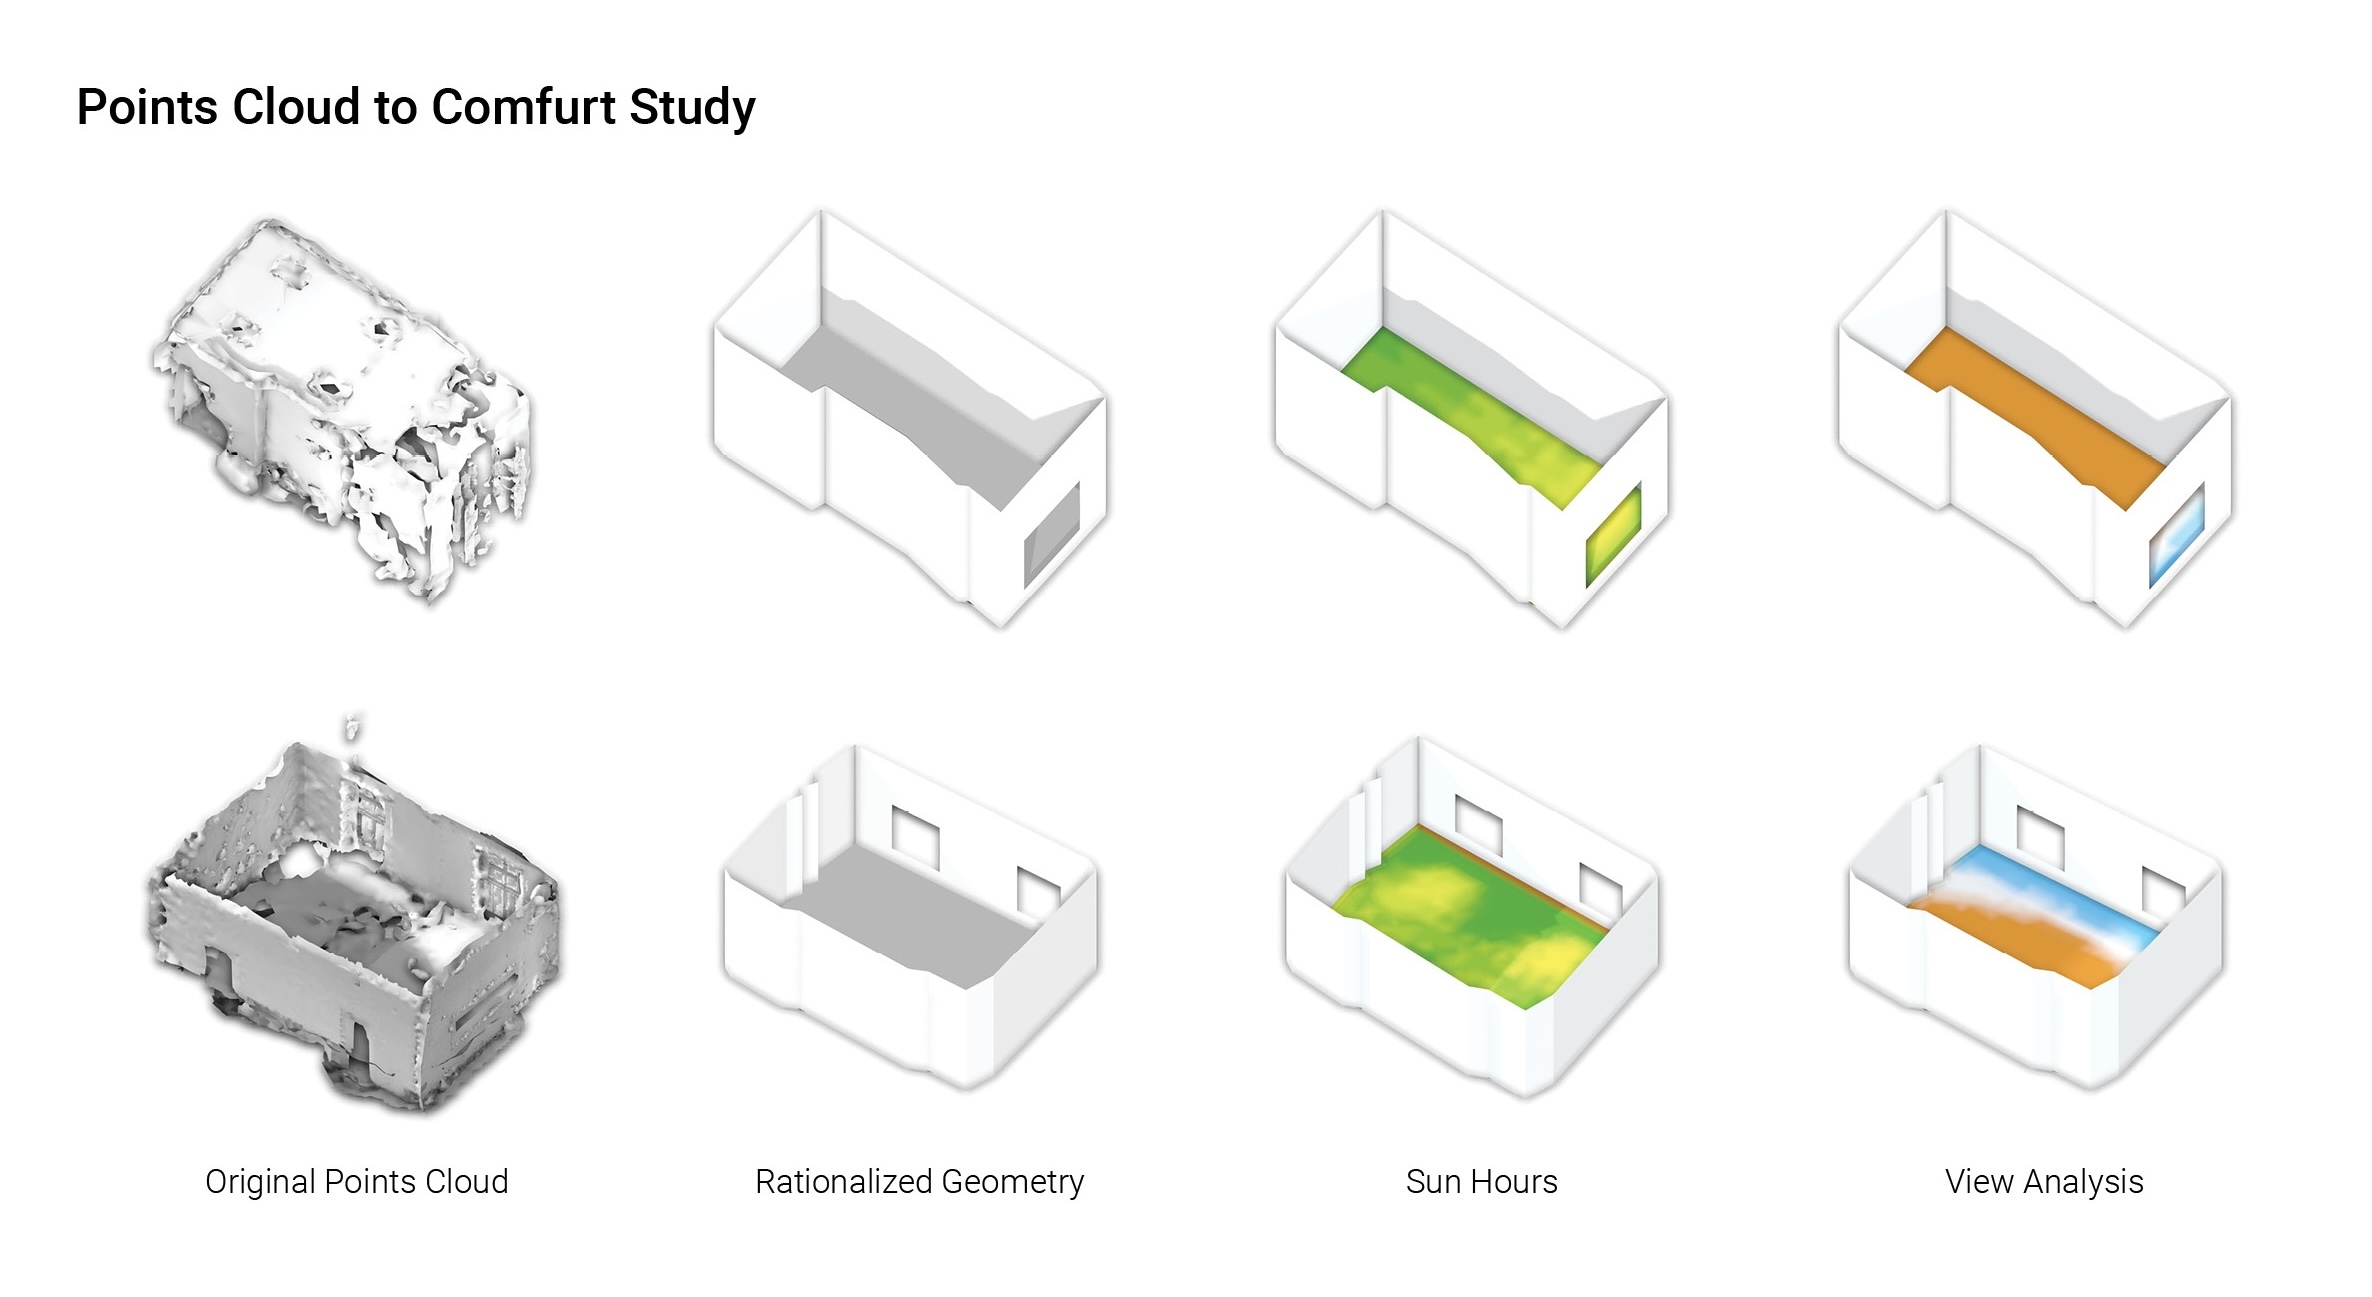
This project develops a tool for real estate value assessment through indoor comfort analysis, including daylight, visual, and spatial factors. It preprocesses raw point clouds into rationalized geometry using machine learning and computer vision, enabling simulations with Ladybug in Grasshopper. Results are integrated into a web viewer for easy interaction, empowering residents and real estate owners to assess and improve property value. My role was leading the implementation of the geometry rationalization process.
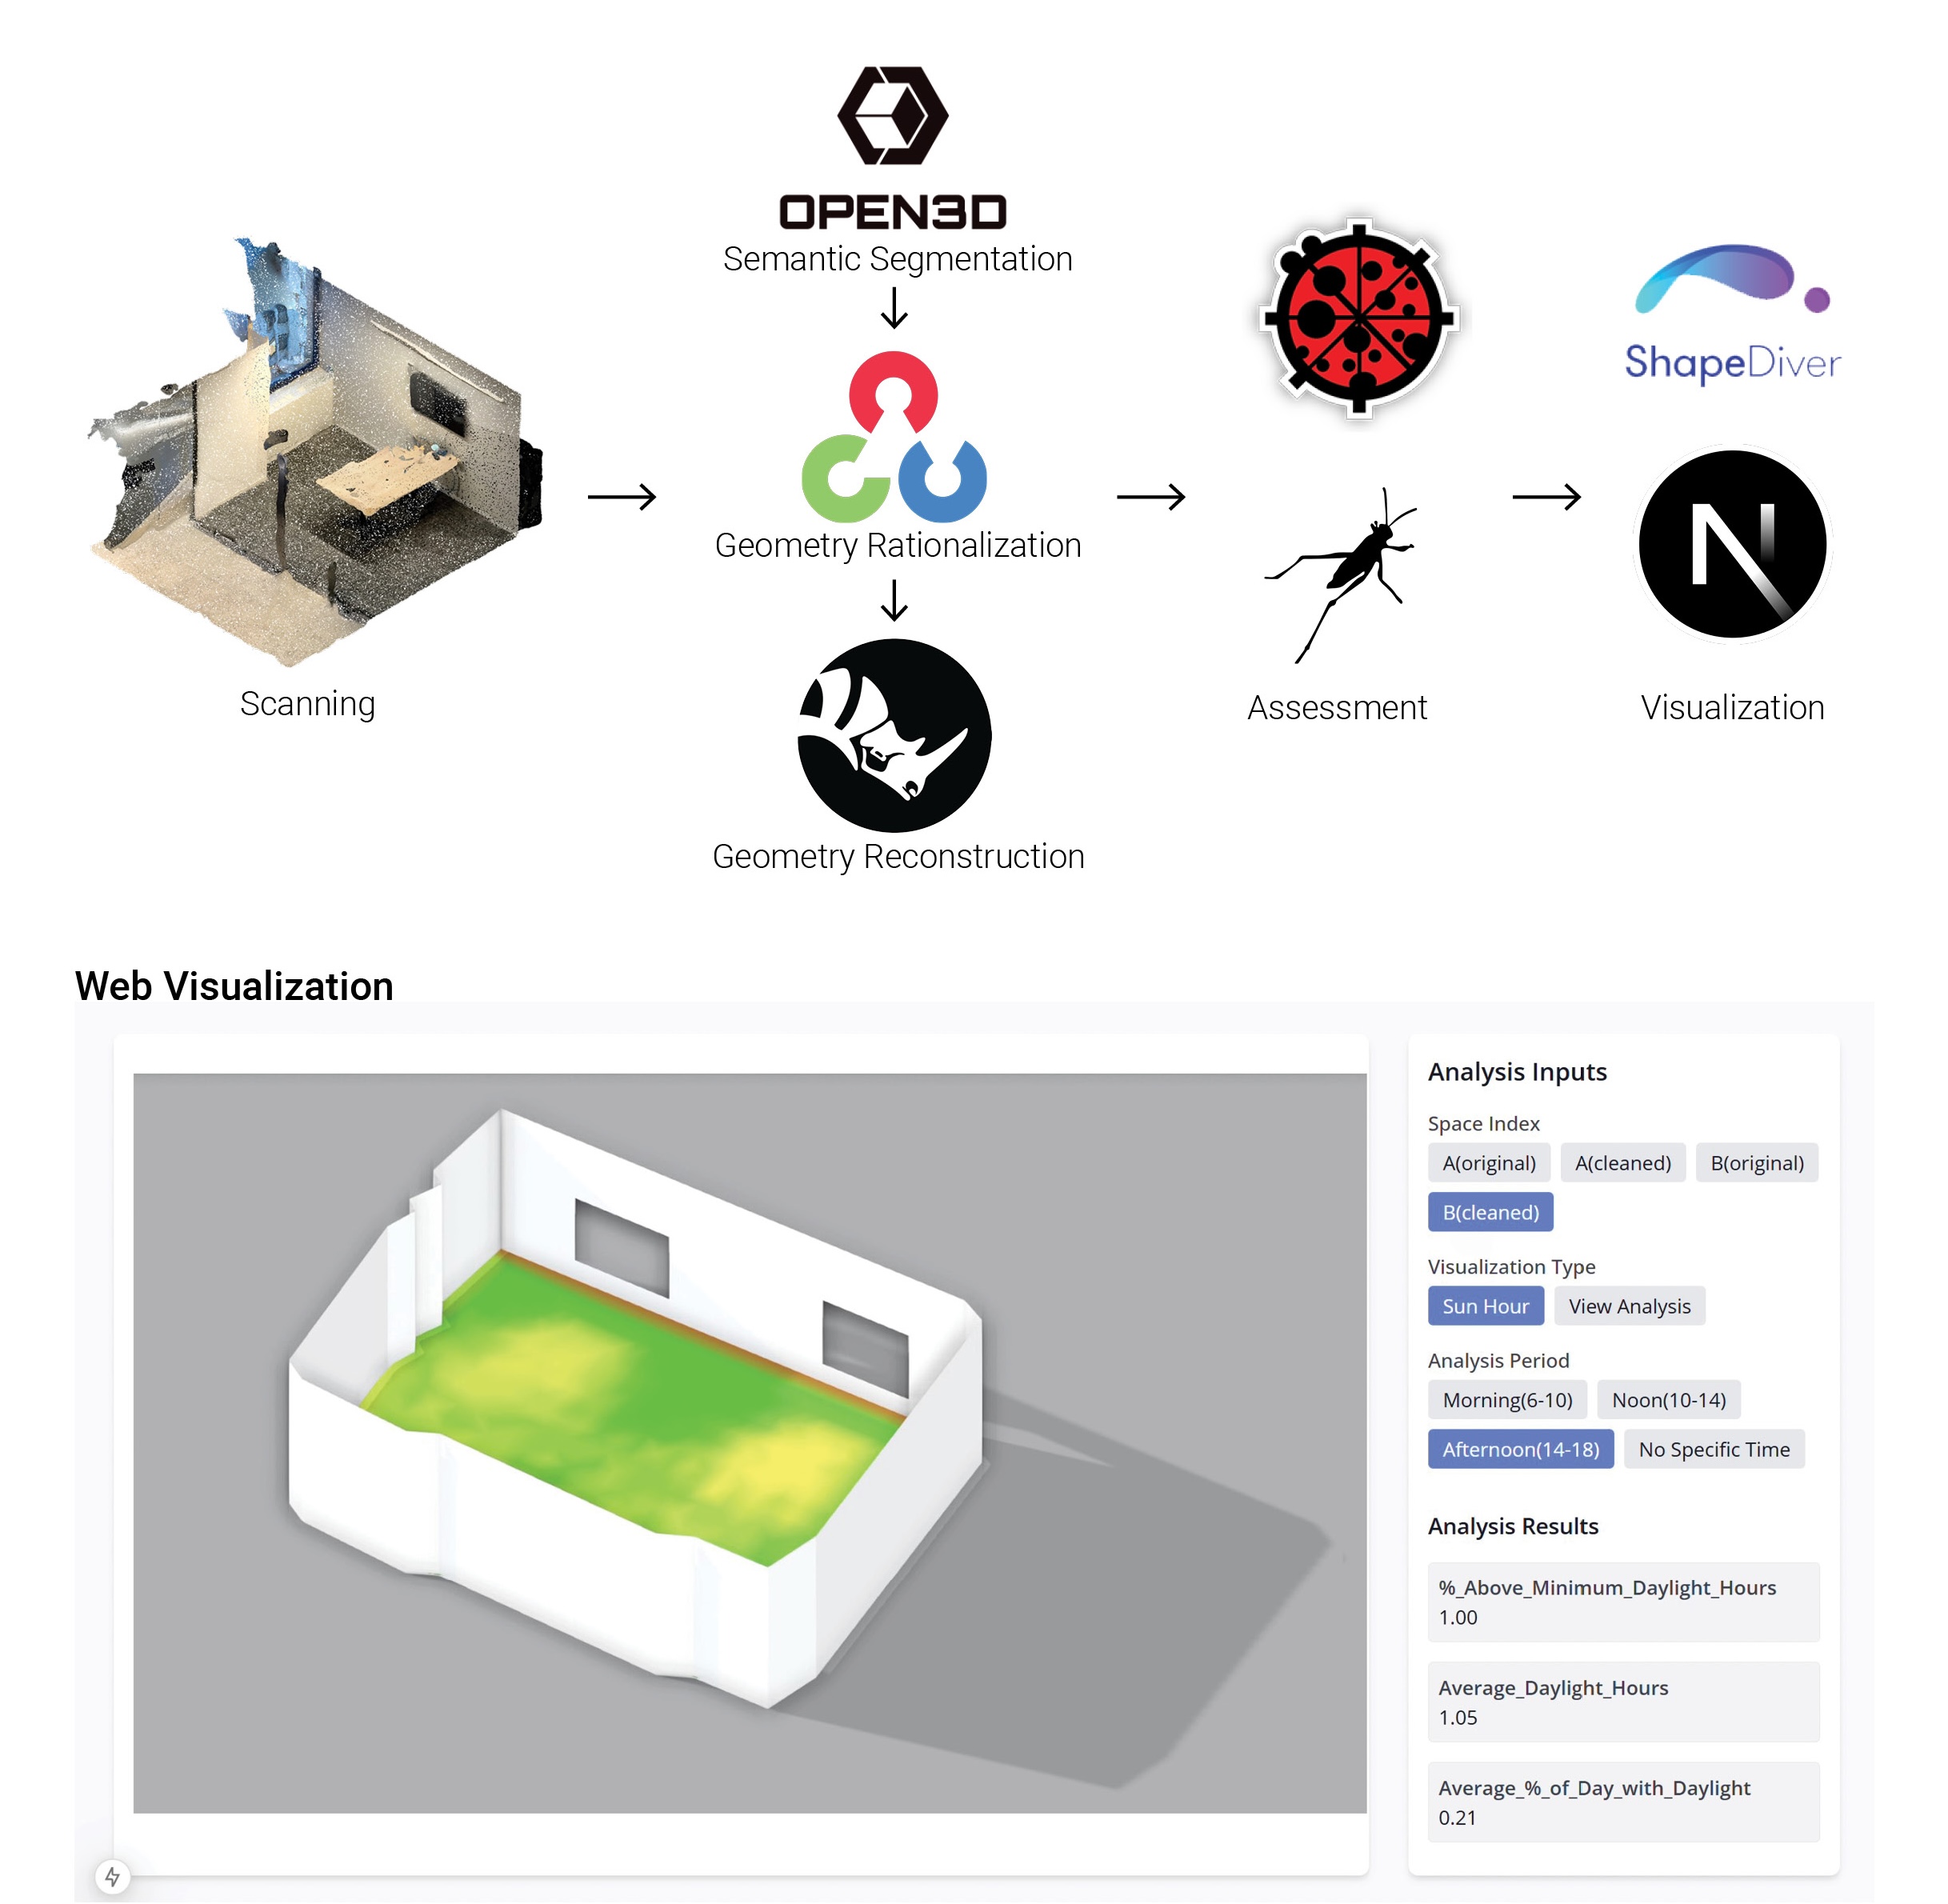
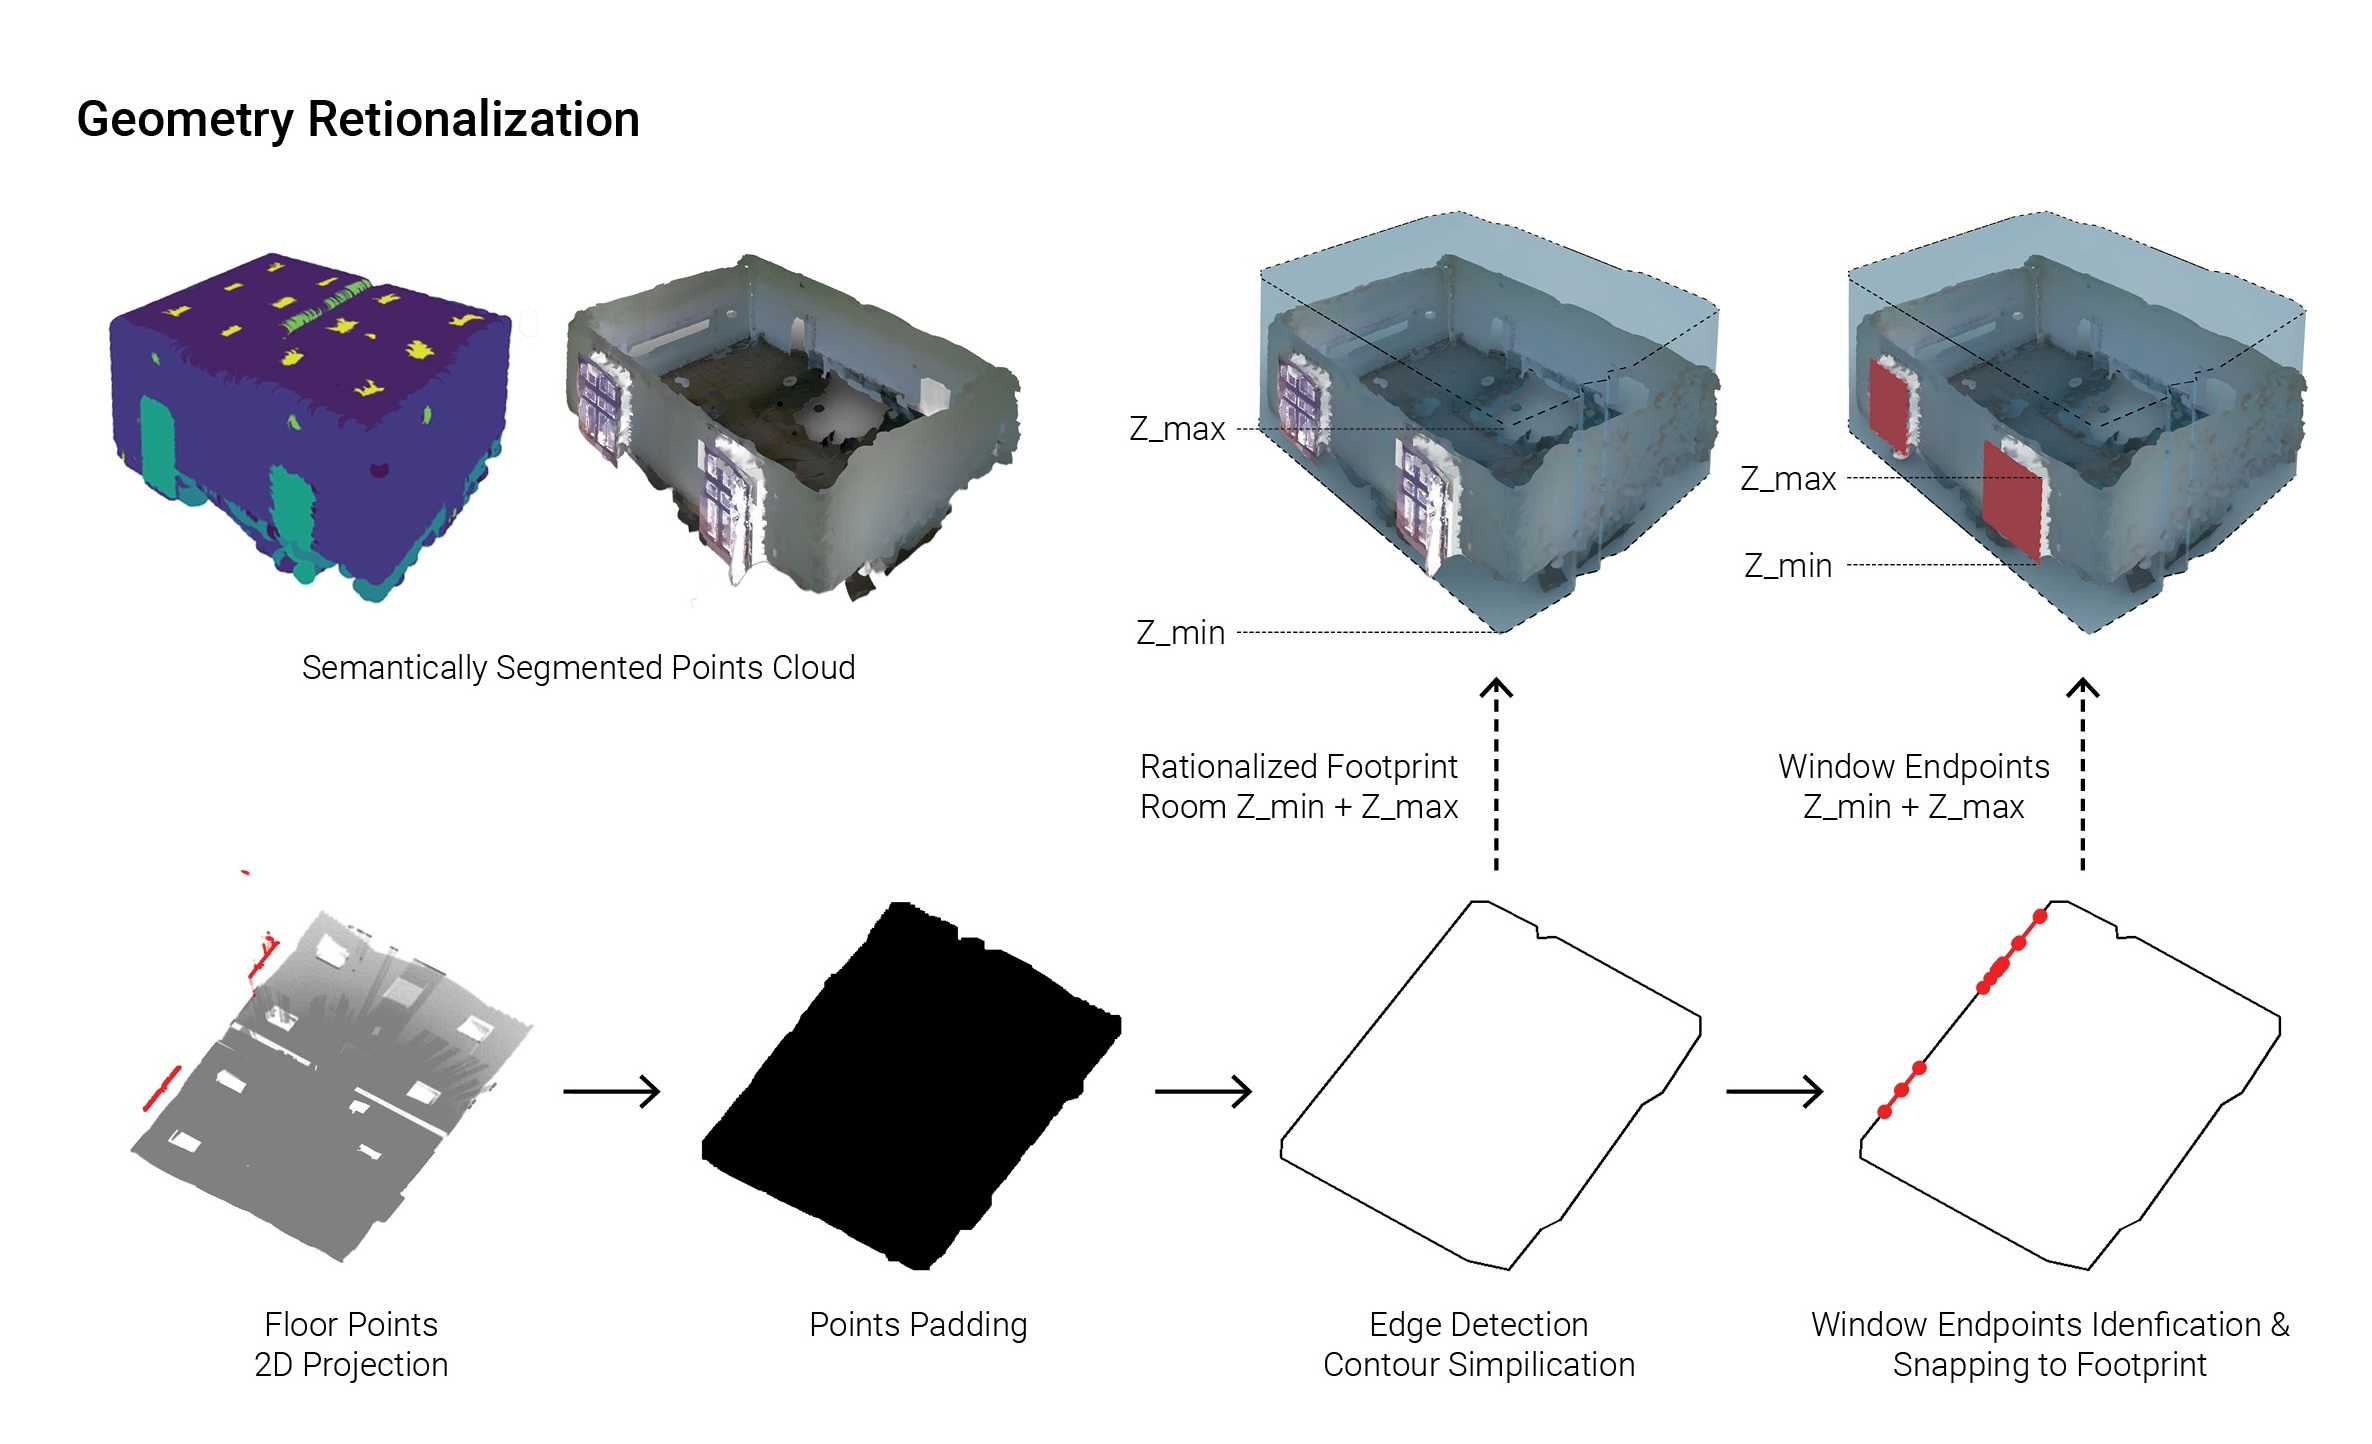
The 3D point cloud is segmented into building elements (e.g., floor, ceiling, walls, windows). Floor points are projected onto a 2D plane and padded, which is processed with edge detection to extract the building footprint. The footprint is then simplified and refined for clarity. The Z-min and Z-max values of walls are calculated to determine the room height. For windows, the two furthest endpoints on the footprint are identified to define horizontal extents, and their Z-min and Z-max values are calculated. for the parametric reconstruction of windows.
Personal Website
Web dev
Personal Website
GitHub Link
Ongoing
Personal Project
Amber Su's research, publications, designs, and projects :)

Plan Gen
Rule-based architecture floor plan generator
Plan Gen
Rule-based floor plan generator - GitHub Link
2023 Spring, Cornell University, CS 3110
Instructor: Justin Hsu, Dexter Kozen
Collaborator: Brittanie Chen, Jessie Zhang, Tony Liu
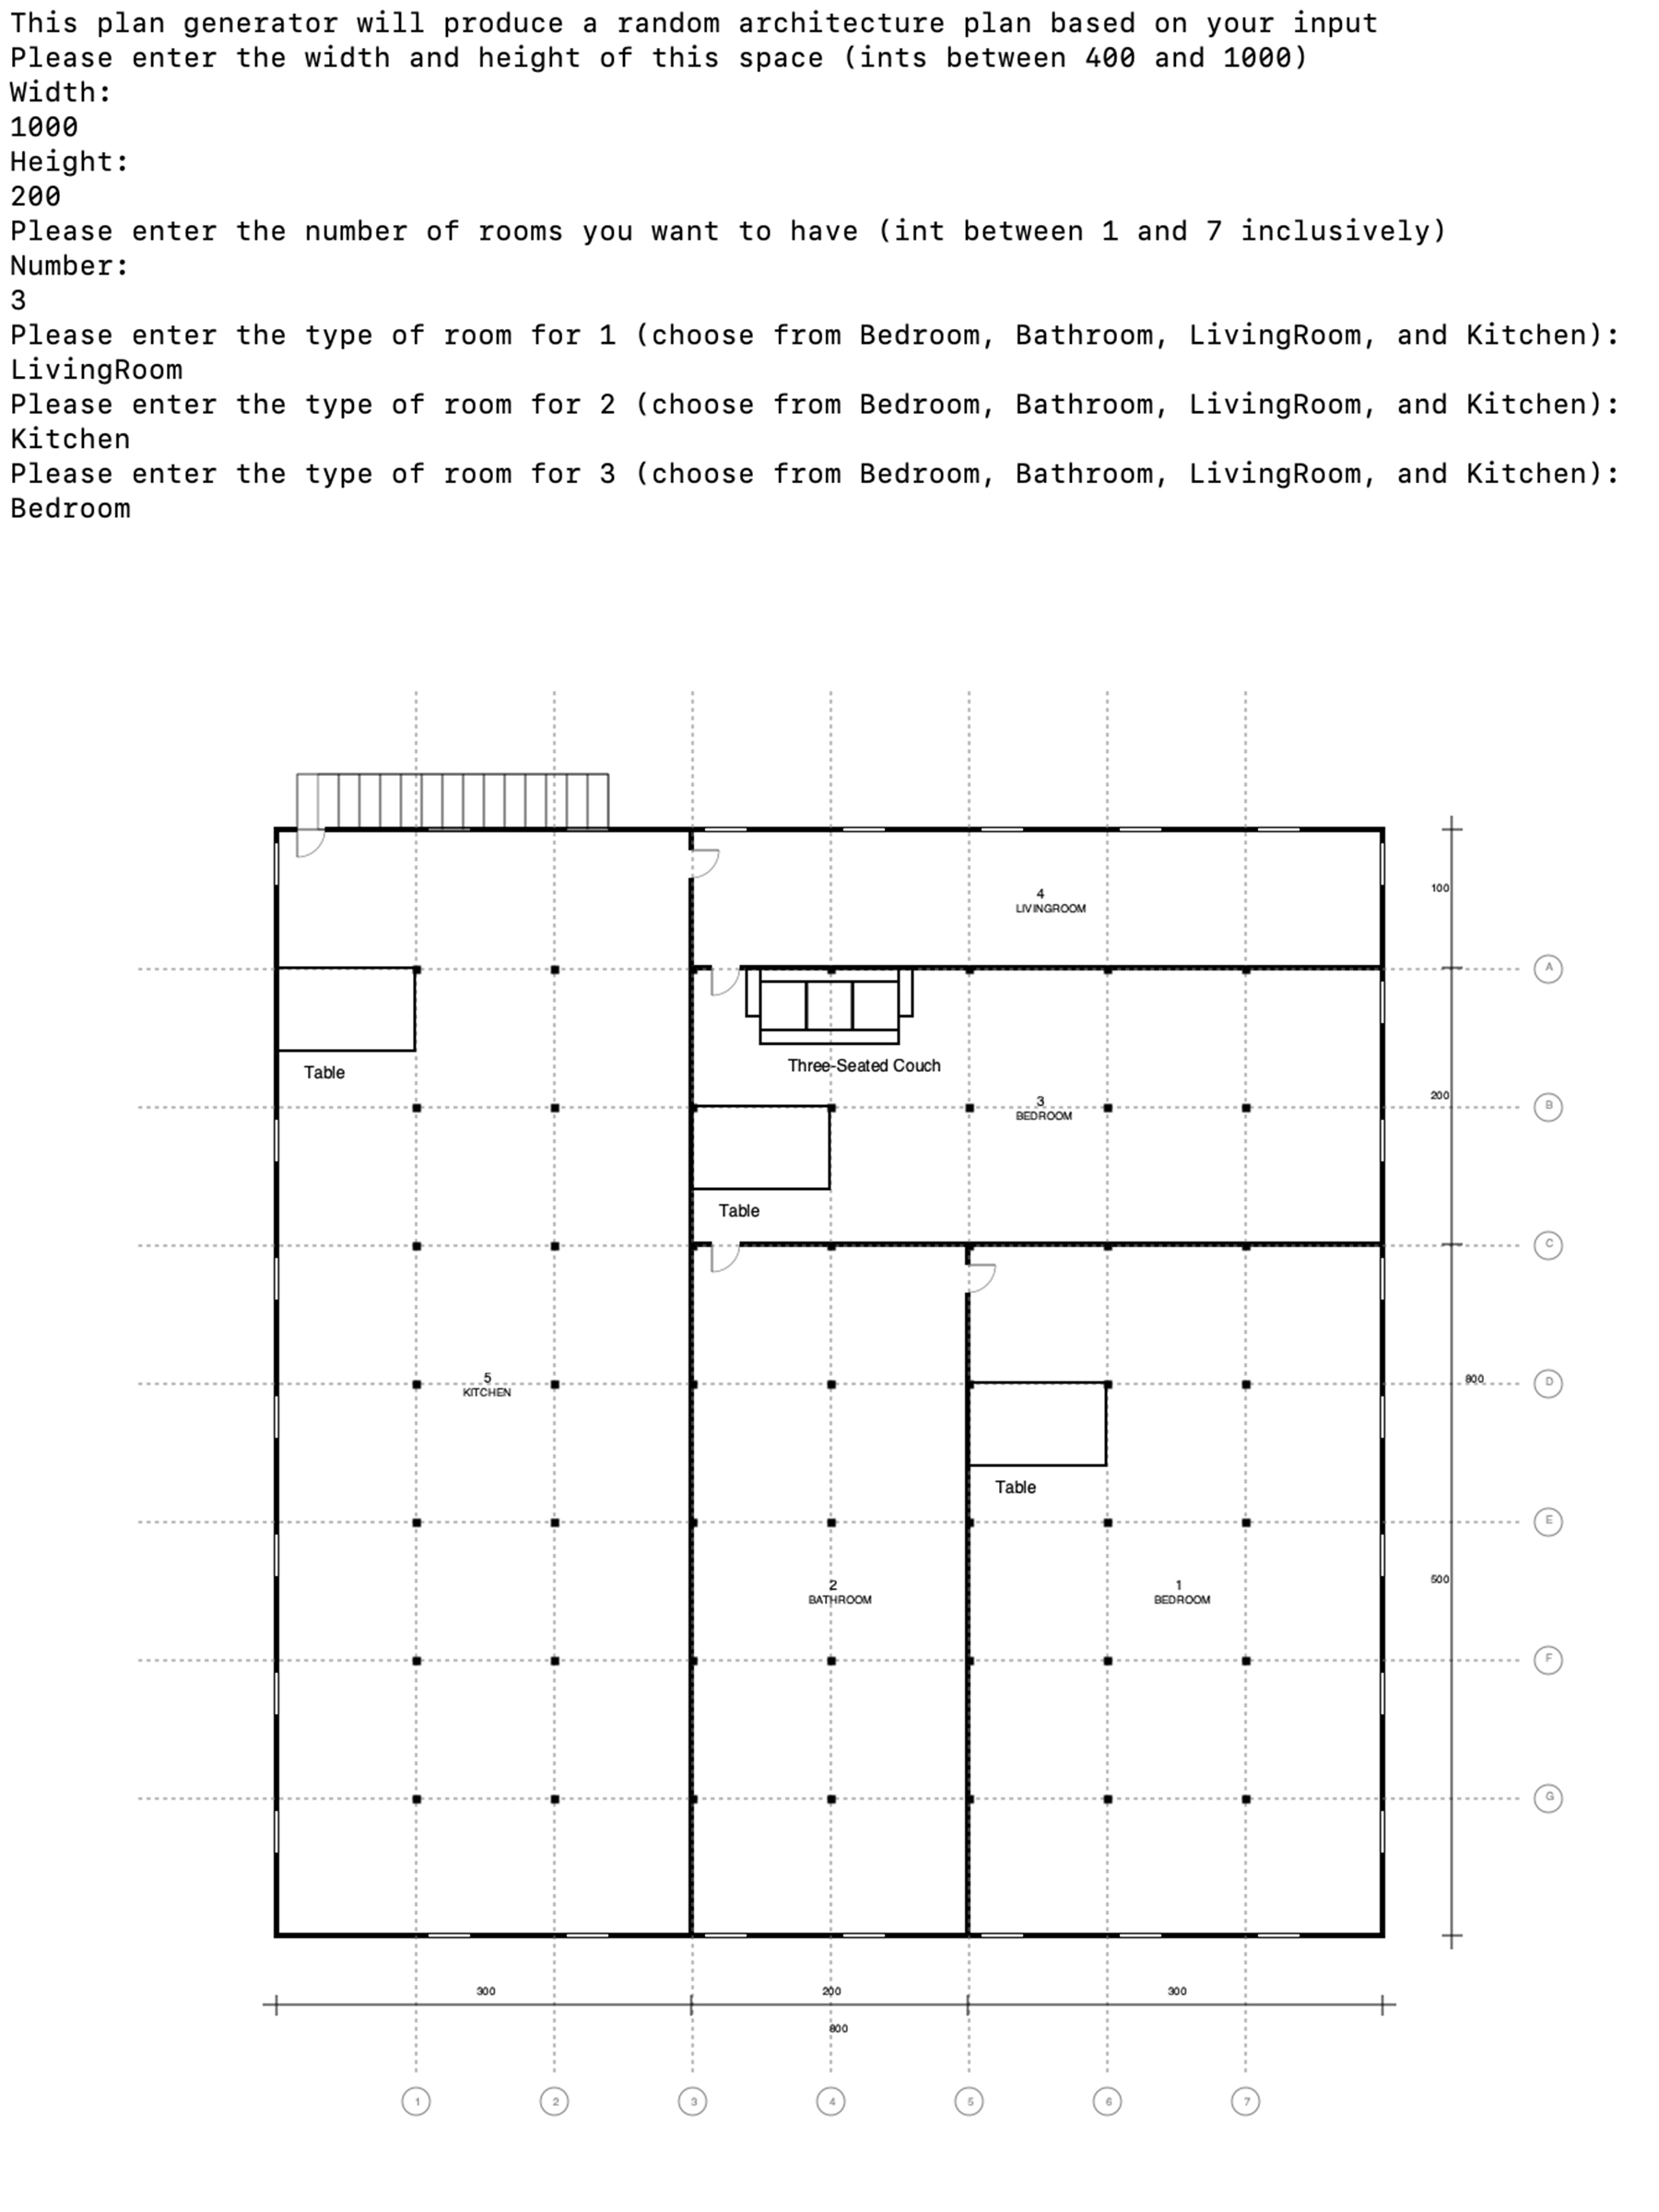
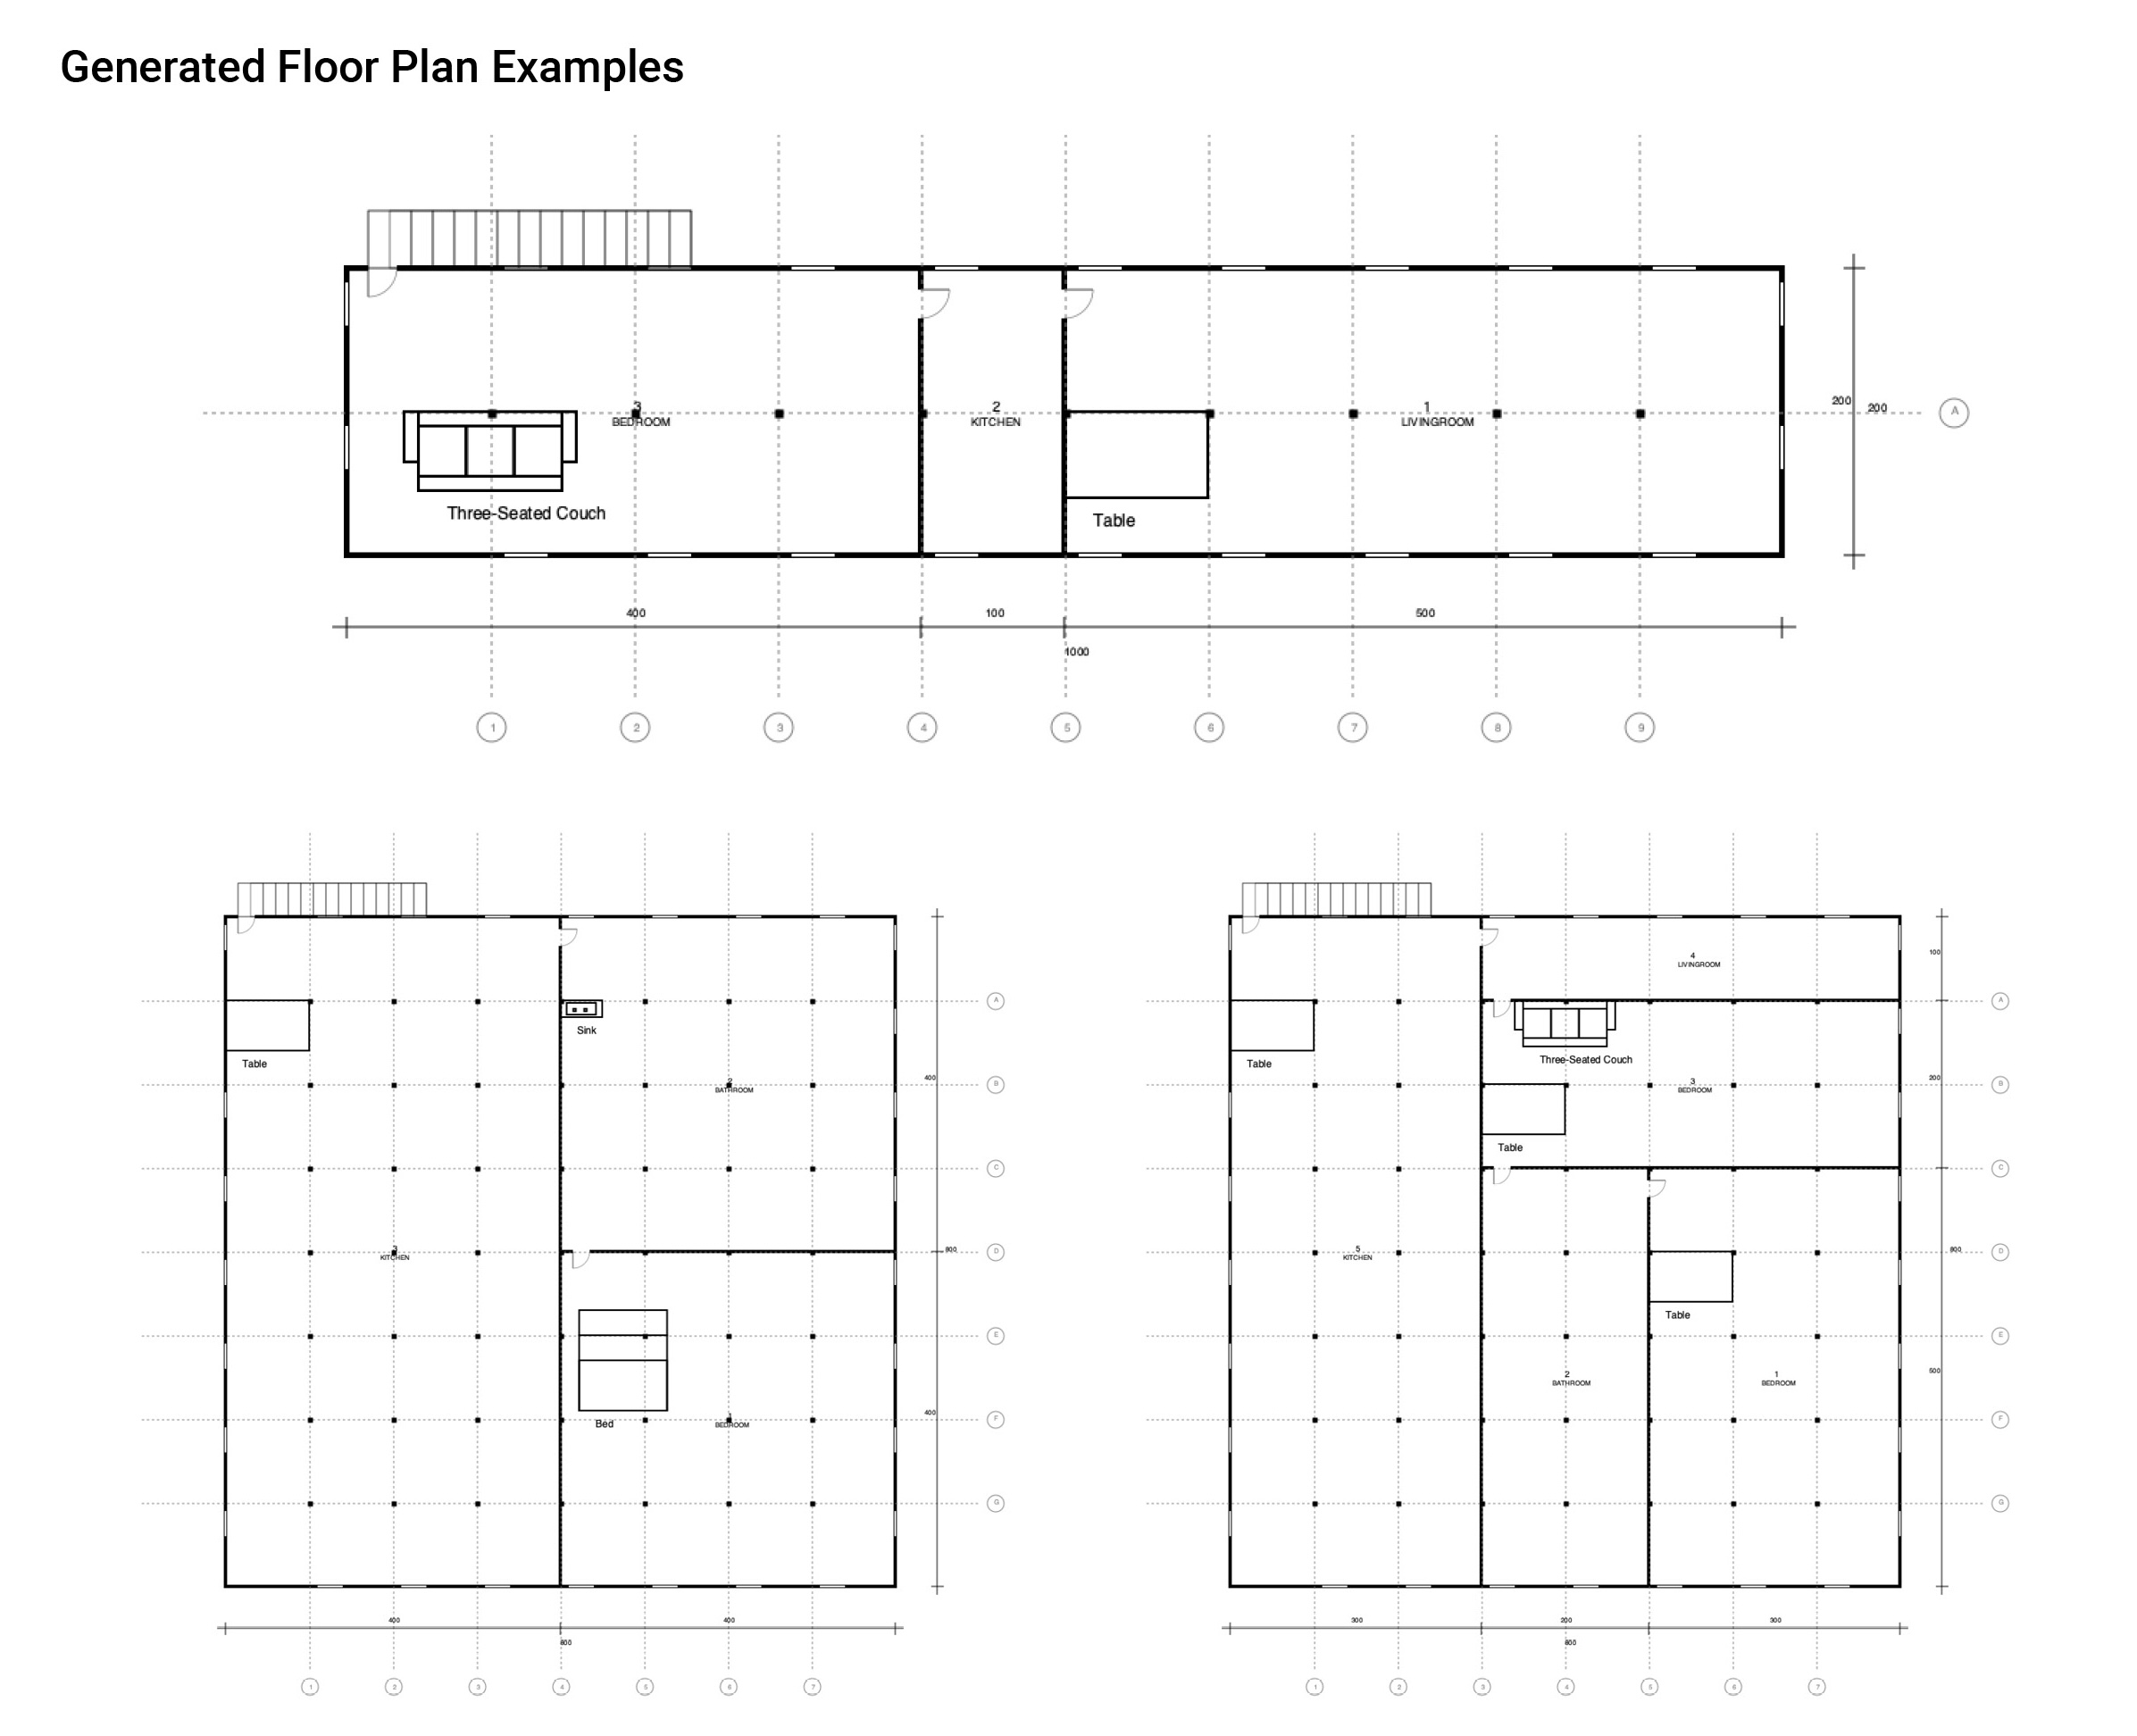
The Plan Generator is an interactive tool developed entirely in the functional programming language OCaml. It is designed to generate randomized layouts based on user-defined parameters. By accepting inputs such as the dimensions of a space (width and height), the number of rooms, and their specific types, the program produces multiple layout options that adhere to the provided criteria.

Pomopals
Productive and social web app
Pomopals
GitHub Link
2024 Fall, Cornell University, BigRed//Hacks 2024
Collaborator: Brookeye Ye, Maggie Chen, Sarah Zhong
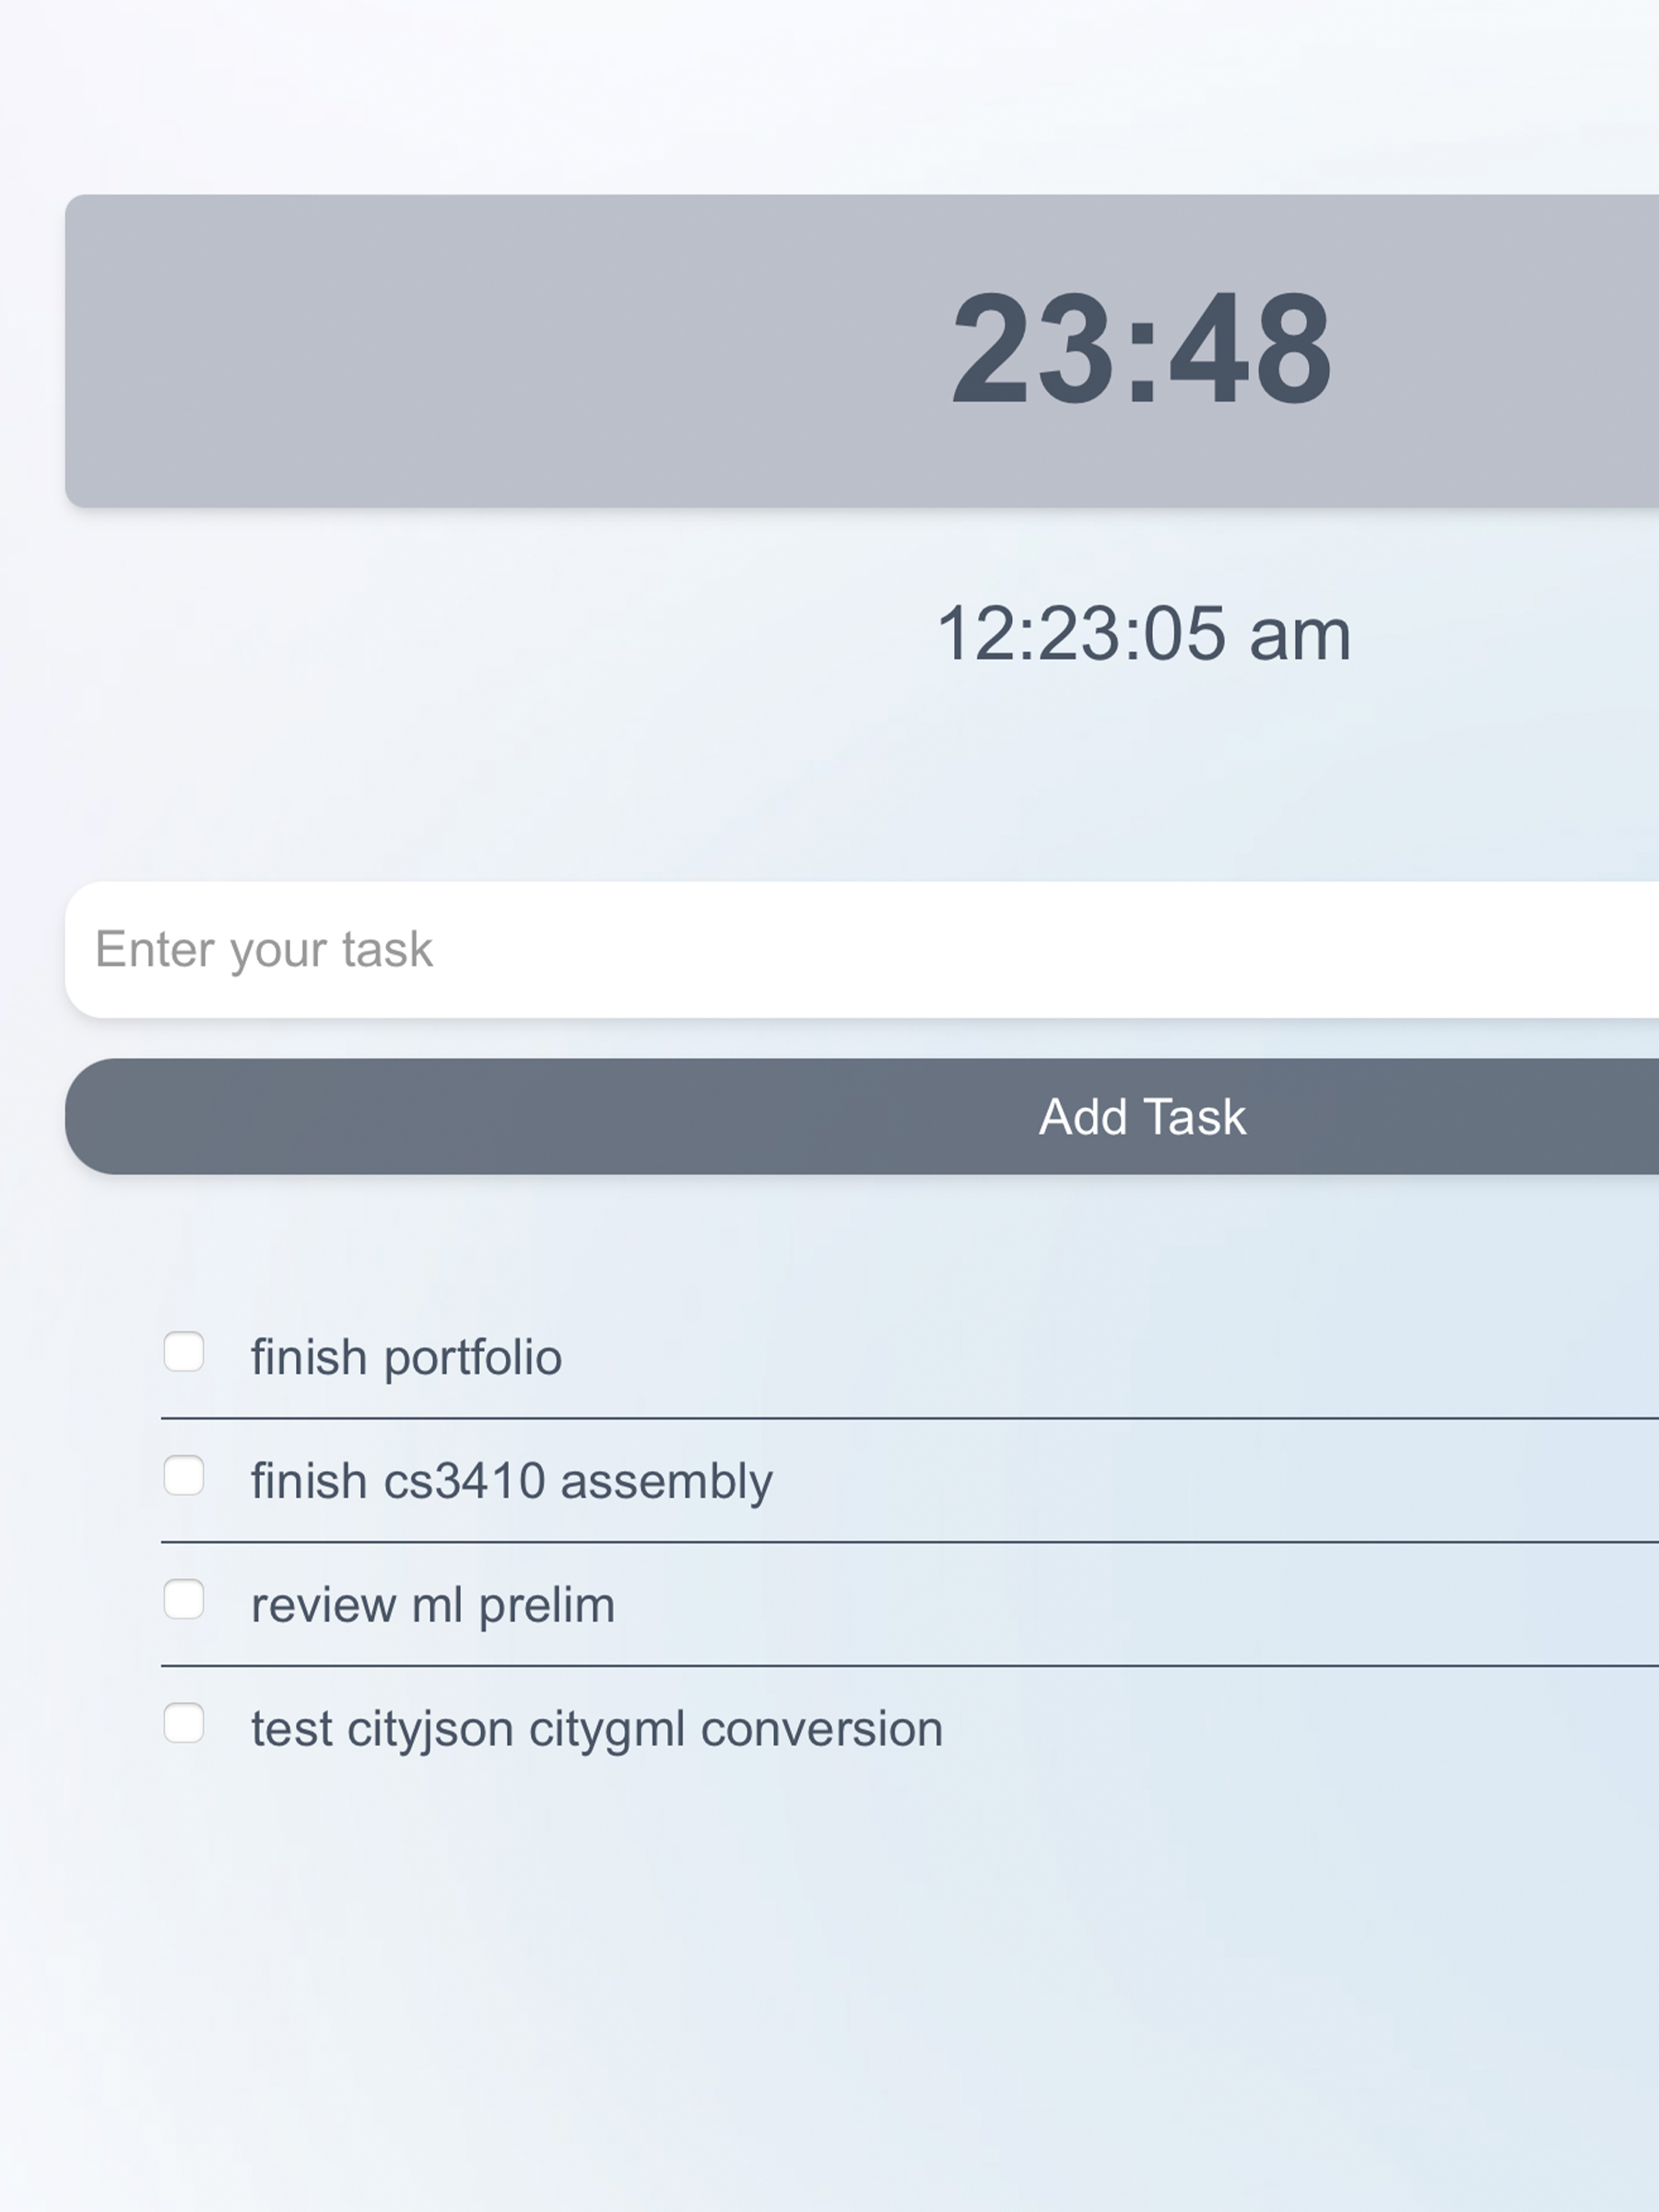
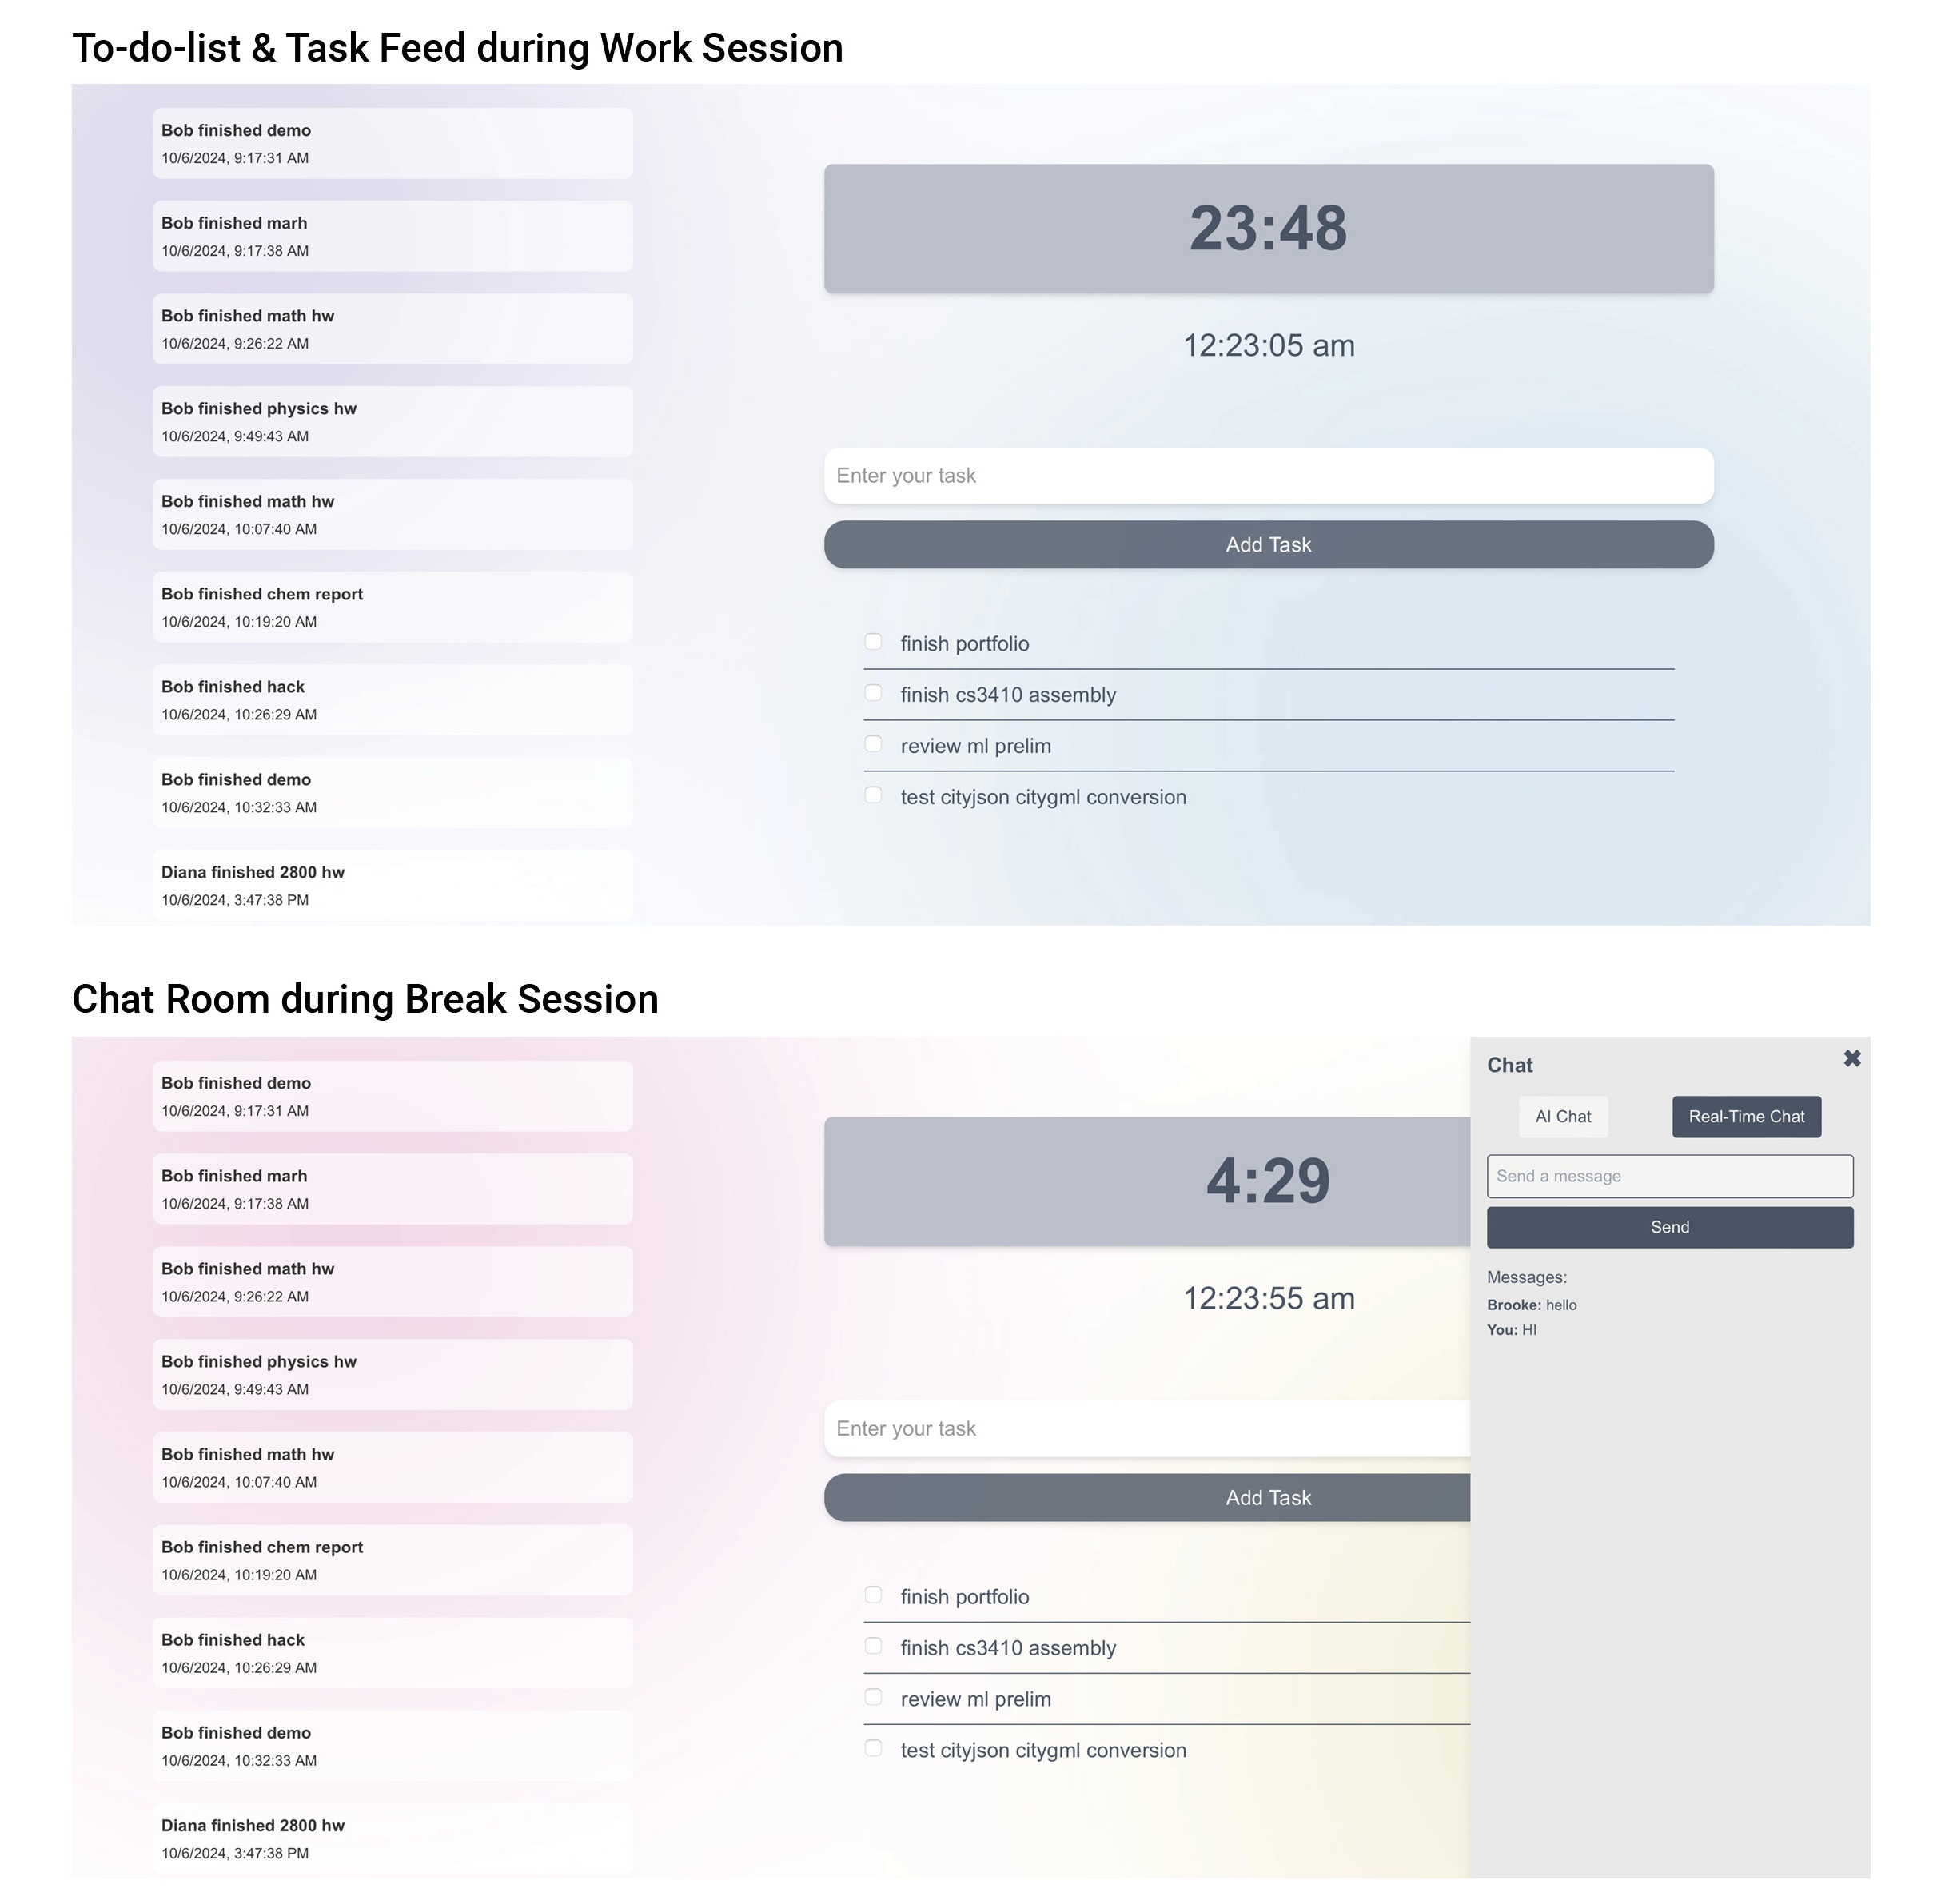
Pomopals is a user-friendly web app that blends the Pomodoro technique with a social element, enabling users to work independently while staying connected through shared productivity. Users follow 25-minute work sessions and 5-minute breaks, with a global chat for socializing during breaks. Key features include task management, global task feed, and chat room. I was responsible for developing the to-do list and global task feed using Next.js and MongoDB.
Water Chandelier
Tallinn Architecture Biennale, 2022
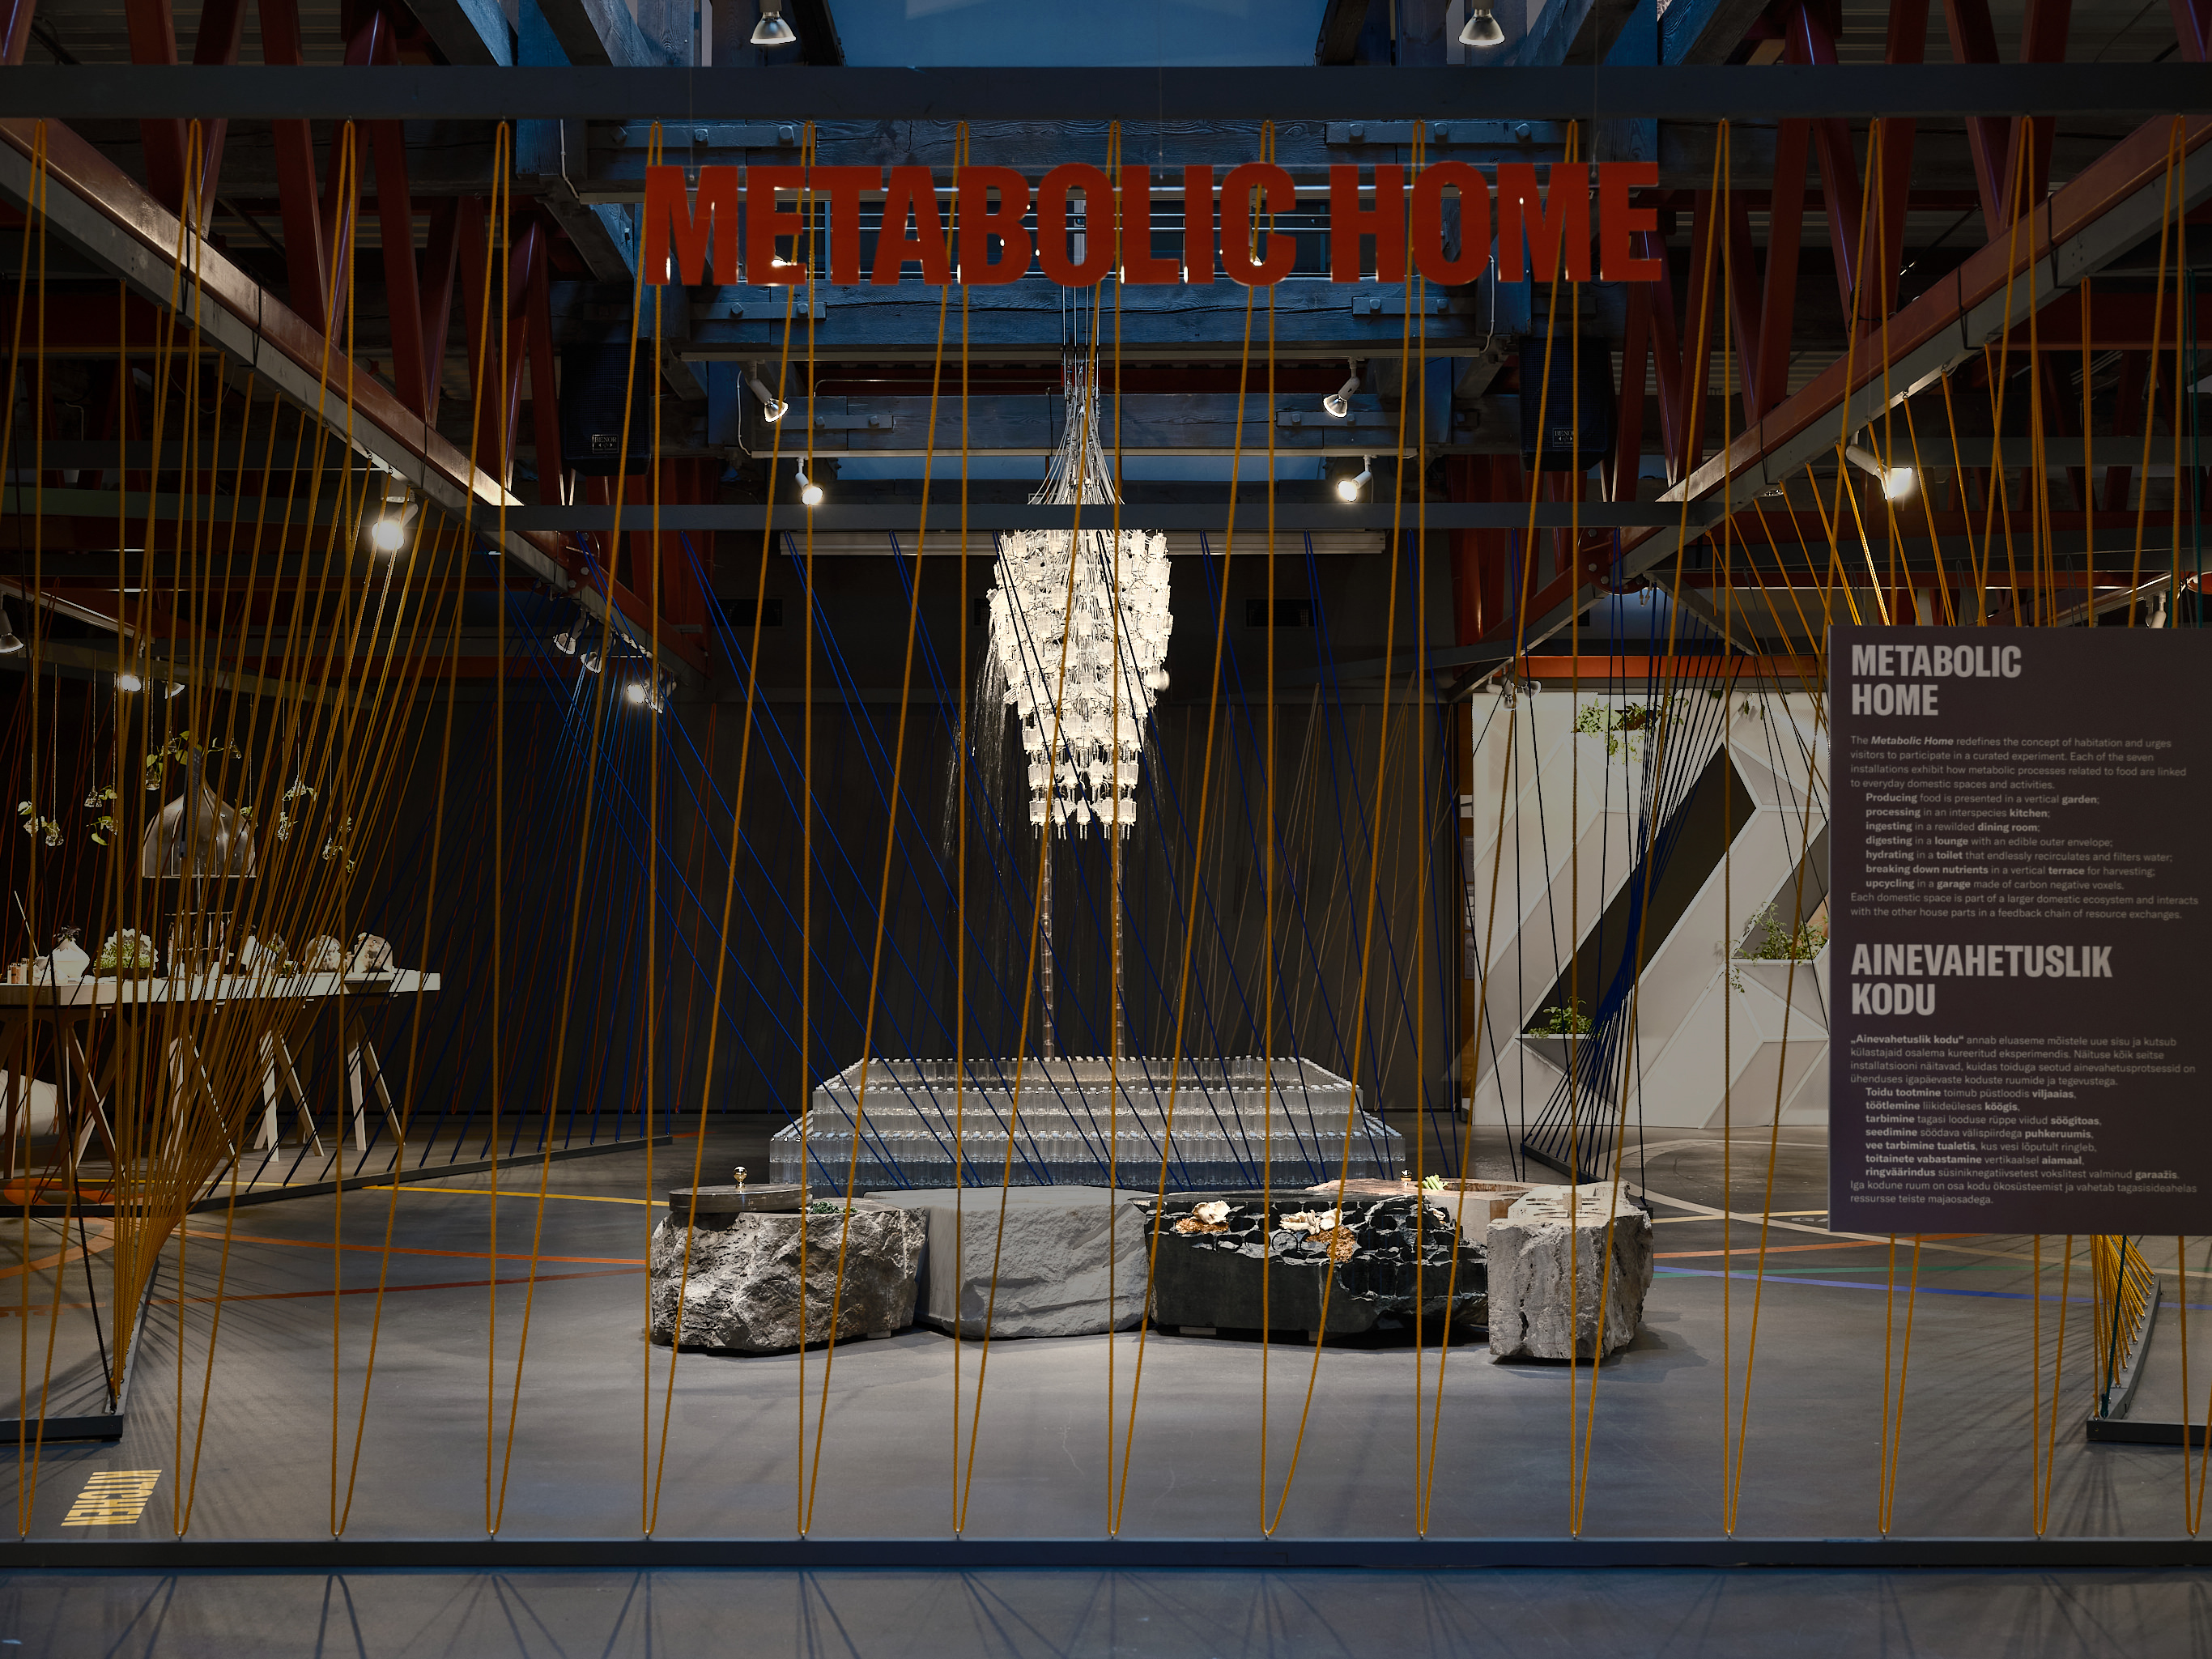
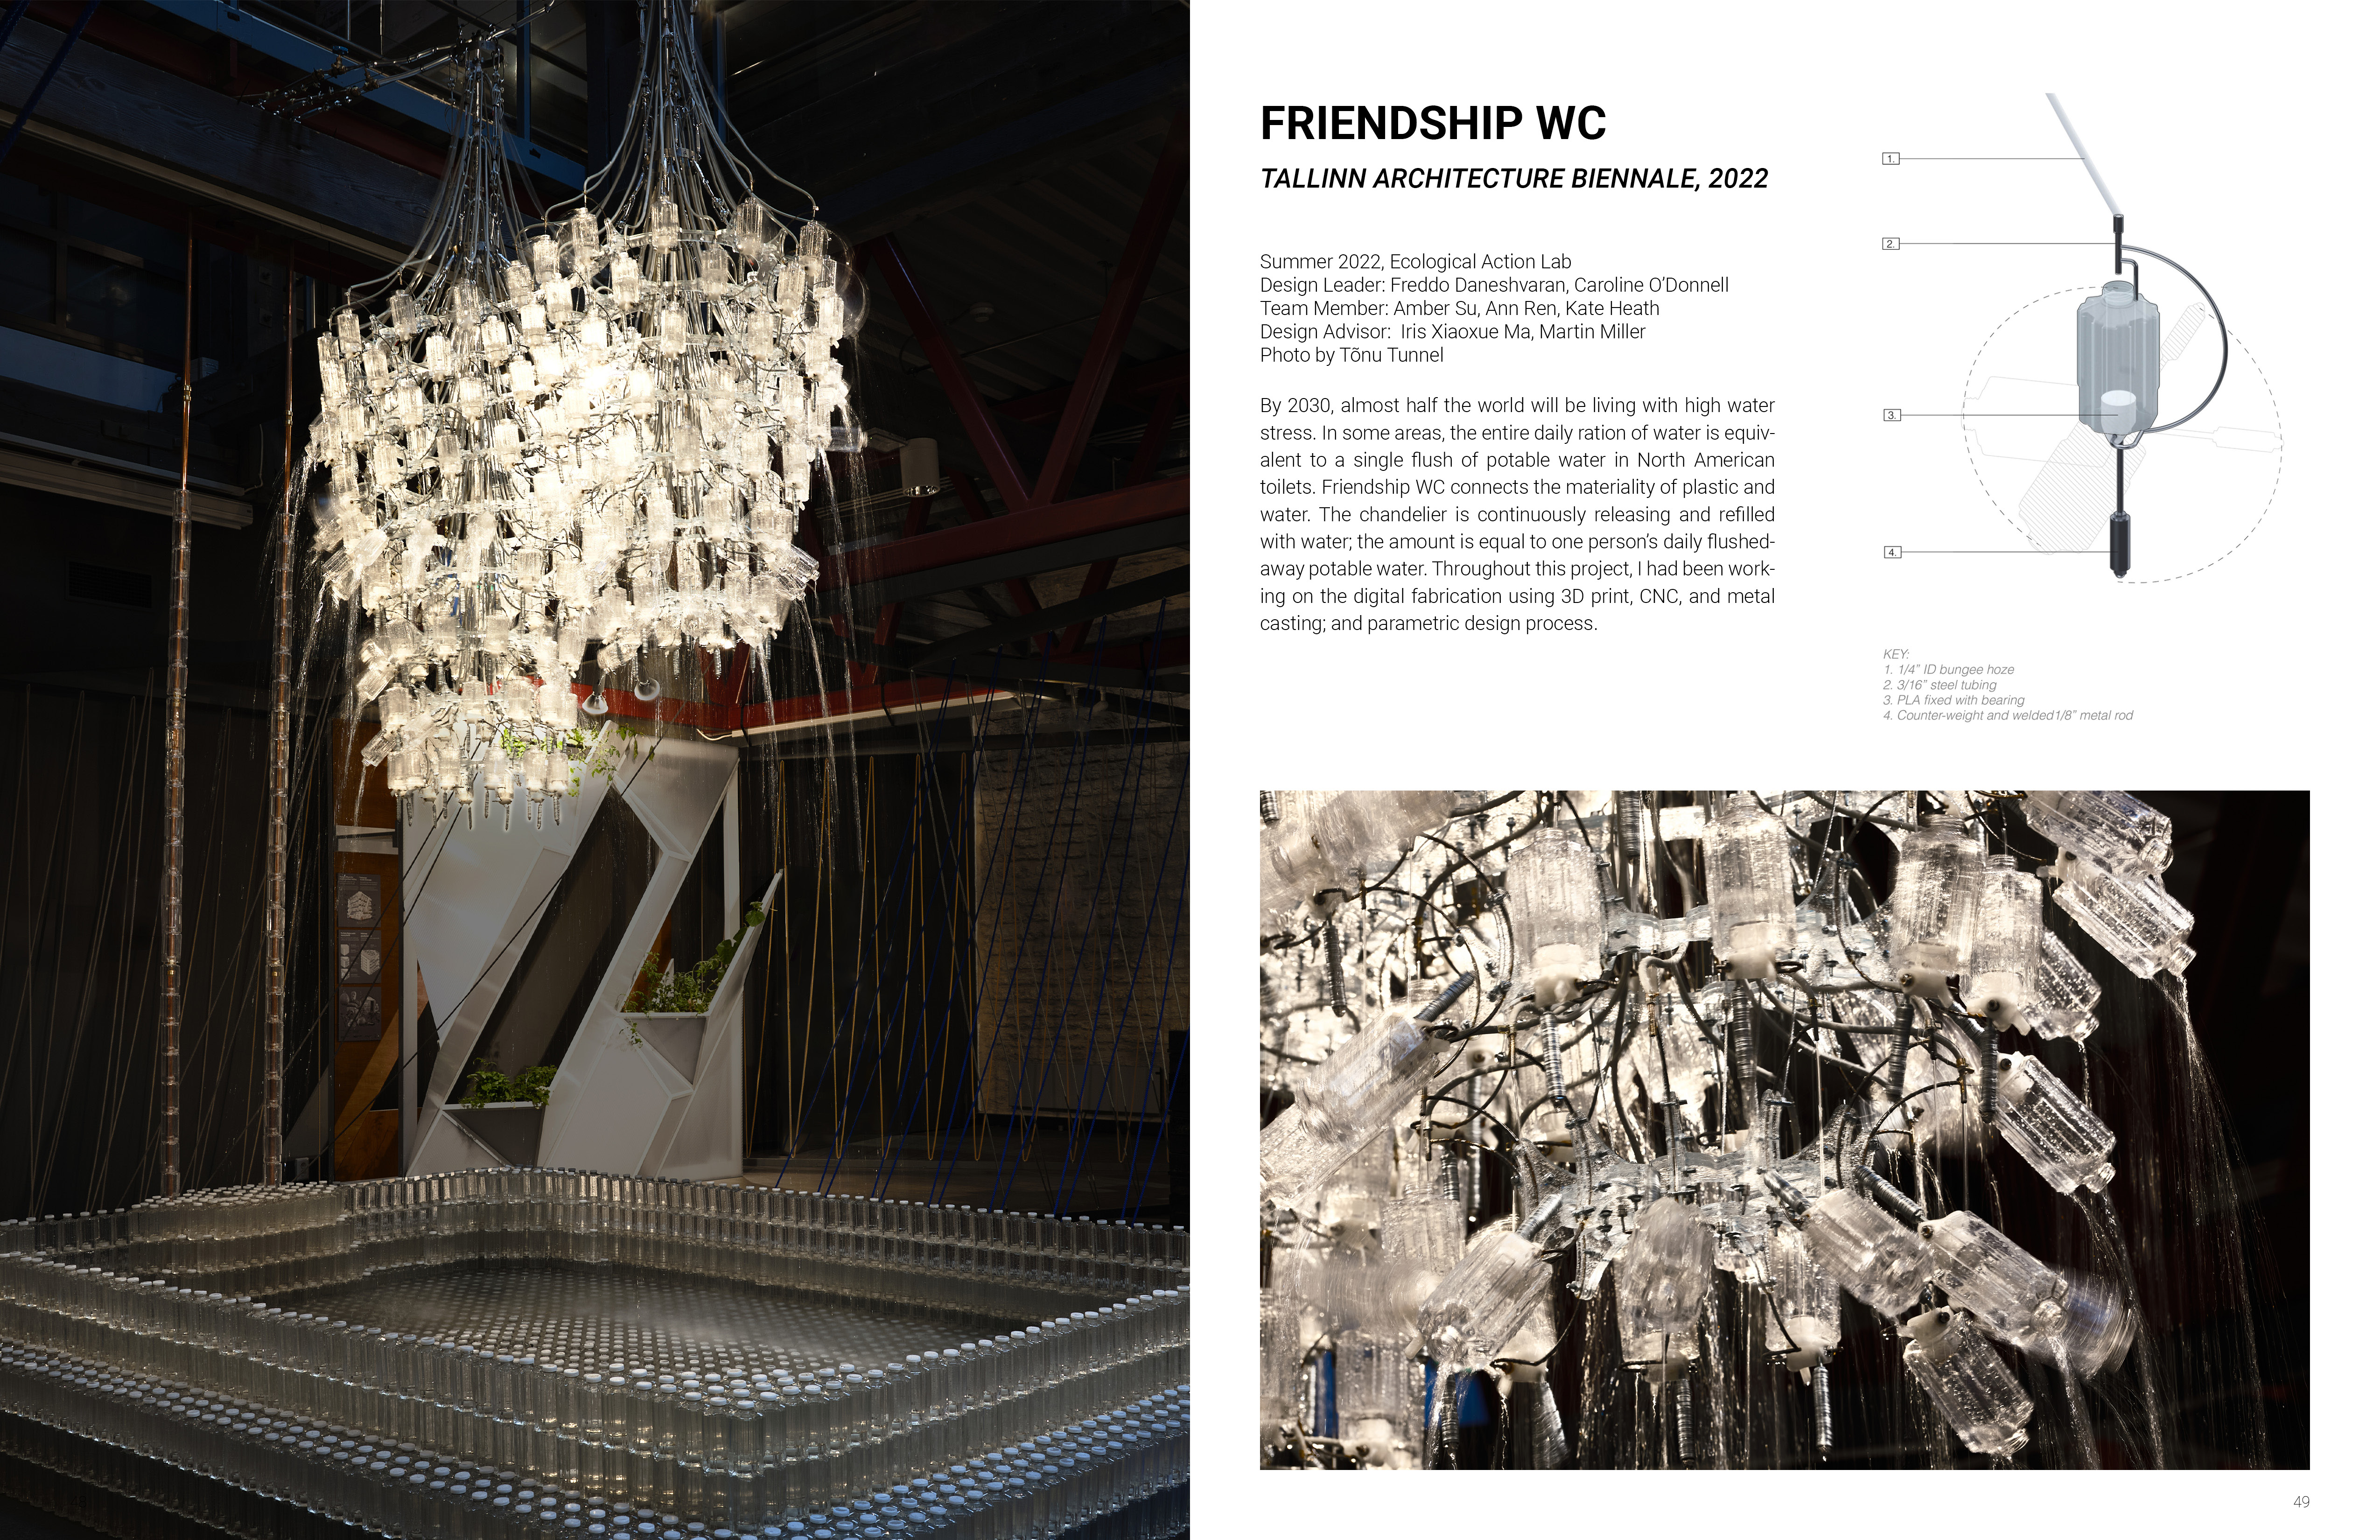
Friendship WC
Summer 2022, Cornell University, Ecological Action Lab
Design Leader: Freddo Daneshvaran
Team Member: Amber Su, Ann Ren, Kate Heath
Design Advisor: Caroline O’Donnell, Iris Xiaoxue Ma, Martin Miller
Photo by Tõnu Tunnel
By 2030, almost half the world will be living with high water stress.
In some areas, the entire daily ration of water is equivalent to a single flush of potable water in North American toilets.
Friendship WC connects the materiality of plastic and water. The chandelier is continuously releasing and refilled with water;
the amount is equal to one person’s daily flushed-away potable water.
Throughout this project, I had been working on the digital fabrication using 3D print, CNC, and metal casting; and parametric design process.
Further Info